Should I Buy Bitcoin Now? A Case Study on Identifying the Entry Point
by Esin Syonmez
Share:

If you’re reading this, you’re probably wondering whether now is the right time to buy Bitcoin. With the BTC price currently sitting at $63,925, and after a year filled with market fluctuations and the post-halving uncertainty from April, the crypto world is expecting the next big move. But when exactly is the moment to invest?
The truth is, timing the market can feel intimidating, especially when everyone seems to be either warning about missing out on the next bull run or cautioning against buying at the top. So, where does that leave you?
This guide is designed to answer that very question. By the time you reach the end, you won’t be left guessing. By using Bitcoin as a case study, we’ll break down how to apply essential yet simple strategies—whether for Bitcoin or other cryptocurrencies—so you can confidently make your own buying decisions.
Our goal is simple: to equip you with the knowledge and confidence to decide the best point to enter the market based on data, not speculation or fear.
Sources and Methods: What to Look For and How to Analyze It
When considering whether to buy Bitcoin, or in fact any asset, it's essential to know where to find reliable information and how to analyze it. Understanding the tools and methods available can help you make informed decisions based on data, rather than emotions or market hype.
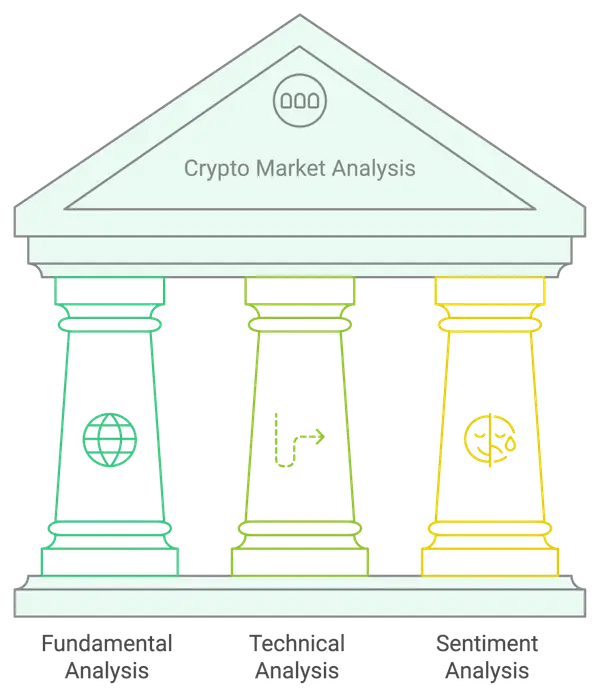
We’ll be using three key approaches throughout this guide:
- Fundamental Analysis: Understanding the larger forces at play, such as adoption, regulatory updates, and market trends.
- Technical Analysis: Looking at charts and data-driven tools like the RSI, moving averages, and candlestick patterns to find potential entry points.
- Sentiment Analysis: Gauging the overall mood of the market through tools like the Crypto Fear and Greed Index and social sentiment.
This foundation will help you assess Bitcoin's current state and guide your own crypto buying decisions. We’ll explore each of these methods in more detail in the sections ahead.
Fundamental Analysis: Why Bitcoin is Still Promising
Fundamental analysis of Bitcoin looks at the broader factors that influence its value, like its technology, adoption, market trends, and regulatory environment. Here's how we approach this analysis and how you can do it yourself.
- Bitcoin’s Scarcity
Bitcoin’s value is deeply tied to its fixed supply of 21 million coins. This scarcity is built into Bitcoin’s protocol, making it deflationary. Each halving event (the most recent one in April 2024) reduces the rate at which new Bitcoins are created. After each halving, fewer Bitcoins enter circulation, which historically leads to price increases over time, as demand remains steady or grows.
How to Analyze This Yourself:
- Source to check: On-chain data platforms like Glassnode track Bitcoin’s halving schedule, block production, and supply metrics.
- What to look for: Look for Bitcoin’s supply metrics, especially the impact of halving events. Understand how supply reduction affects long-term price trends.
- Bitcoin’s Market Dominance
Despite the growth of other cryptocurrencies, Bitcoin continues to lead the market in terms of capitalization. It’s the most widely held cryptocurrency and is still seen as a “safe haven” asset compared to smaller, more volatile tokens. Institutional interest, such as the approval of Bitcoin ETFs in January 2024 by the SEC, has played a key role in maintaining this dominance.
How to Analyze This Yourself:
- Source to check: Crypto analytics platforms like CoinMarketCap or TradingView provide data on Bitcoin’s market share relative to other cryptocurrencies.
- What to look for: Track Bitcoin’s share of the total crypto market capitalization. A high dominance indicates investor confidence in Bitcoin over other assets, signaling its stability and perceived safety.
- Technological Development and Brief History
Bitcoin’s underlying technology has steadily improved over time. Recent advancements like the Lightning Network have addressed concerns about transaction speed and cost, making Bitcoin more scalable. Additionally, the introduction of Ordinals has brought NFTs to the Bitcoin network, which opens new use cases beyond its role as a store of value.
How to Analyze This Yourself:
- Source to check: Follow blockchain development news through outlets like CoinTelegraph, and track technical upgrades on GitHub or official Bitcoin forums.
- What to look for: Pay attention to updates on Bitcoin’s scalability solutions and emerging use cases.
- Adoption and Market Updates
Global Bitcoin adoption continues to grow. Countries like El Salvador and the Central African Republic have adopted Bitcoin as legal tender, while its use as a hedge against inflation is rising in regions like Sub-Saharan Africa. In the institutional space, companies like Tesla and MicroStrategy have continued to hold Bitcoin on their balance sheets, bolstering its legitimacy.
How to Analyze This Yourself:
- Source to check: Platforms like Chainalysis track Bitcoin adoption across different regions and sectors.
- What to look for: Review how Bitcoin is being used in various parts of the world, particularly in regions where fiat currencies are unstable. Also, check which major corporations or countries are adopting Bitcoin.
- Regulatory Updates: Bitcoin ETFs and Legal Frameworks
The regulatory landscape is a critical factor in Bitcoin’s long-term success. The approval of Bitcoin ETFs by the SEC in January 2024 has made it easier for institutional investors to enter the market, driving demand. In addition, other countries are establishing clearer frameworks for Bitcoin use and trading, helping to reduce uncertainty.
How to Analyze This Yourself:
- Source to check: Financial and crypto news outlets like Bloomberg, CMS Prime, or VanEck provide updates on regulatory decisions.
- What to look for: Focus on ETF approvals and regulations surrounding Bitcoin trading in key markets like the U.S. and the EU. Clearer regulations generally lead to increased adoption, while uncertainty can trigger price volatility.
Technical Analysis: Tools to Understand Bitcoin’s Next Move
In speculative markets like cryptocurrencies, investors often rely on technical data to guide their decisions. That’s where technical analysis comes in, offering a wide range of insightful indicators. By using specific tools to analyze price movements and market trends, you can pinpoint key entry and exit points, helping you make informed decisions.
For this case, we’ll be analyzing Bitcoin with three of the most trusted—and personal favorite—indicators in trading: Moving Averages (MA), the Relative Strength Index (RSI), and the Moving Average Convergence Divergence (MACD).
So, why these indicators? Each one gives us a different piece of the puzzle:
- Moving Averages (MA) help smooth out the price action to show us the overall trend. If the price stays above a moving average like the 21-day EMA, it’s a sign that the market is in a bullish phase, which is exactly what we need to confirm whether Bitcoin is likely to rise further.
- RSI (Relative Strength Index) tells us if the market is overbought or oversold, helping us avoid bad trades. When the RSI is too high, it’s often a sign that a pullback is coming. If it’s low, it might mean the asset is undervalued and could rebound.
- MACD (Moving Average Convergence Divergence) shows us momentum shifts. This is useful for spotting when the current trend might be reversing, which is especially important when markets are as unpredictable as crypto.
These tools work well together to give a fuller picture of what’s happening in the market right now. And don’t worry—while they might sound complicated at first, they’re actually pretty straightforward once you get the hang of them. In the next section, we’ll walk through how each one applies to Bitcoin right now and how you can use these same tools to analyze any asset in the future.
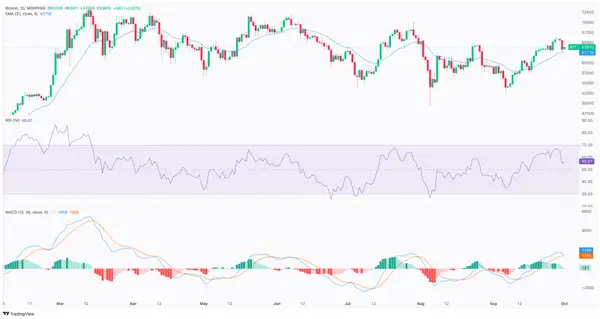
BTC/USD Technical Analysis
- How to Spot the Support and Resistance Levels
– Resistance Level (~$65,000):
Candlestick Patterns: The price has touched or neared $65,000 multiple times but has struggled to break above it, showing that there’s strong selling pressure or profit-taking around this level. Each time Bitcoin has approached this price, it has couldn’t move higher and pulled back. This creates a resistance level, where sellers outnumber buyers.
Historical Price Data: Resistance levels are often psychological barriers. In Bitcoin’s case, large, round numbers like $65,000 act as key levels where traders place sell orders, either to secure profits or to exit the market. This round-number resistance is common in speculative markets.
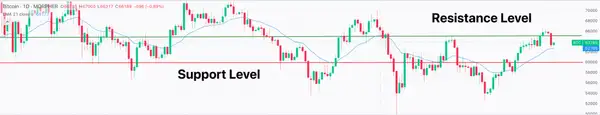
– Support Level (~$60,000):
Previous Bounces: Looking at the chart, Bitcoin has bounced back from the $60,000 level several times in the past. This means that when the price drops to this level, buyers enter the market in large enough numbers to stop the decline and push the price back up.
Psychological Barrier: Just like resistance, $60,000 is a psychologically significant level. Traders often use these large round numbers for setting buy orders, so $60,000 acts as a floor, or support level, preventing the price from falling further.
Multiple Tests of Support: If the price repeatedly tests a support level but does not break below it, this strengthens the case for that level being a solid support zone.
2. RSI (Relative Strength Index) Analysis:
The RSI is sitting at 56.67, which places it in the neutral zone, indicating that the market is neither overbought nor oversold. This suggests no immediate signs of strong bullish or bearish moves.

I chose 50 and 60 as critical markers to watch.
Above 60 could signal increasing bullish momentum, potentially leading to a breakout above resistance.
Below 50 could indicate growing selling pressure, meaning a potential test of the support levels like $60,000.
3. Moving Average (21-day EMA) Analysis:
The price is currently above the 21-day EMA, which suggests that the market is in a short-term uptrend. This moving average acts as a dynamic support level, meaning traders often look at it to decide whether to stay bullish or prepare for a reversal.
Why $62,716 Matters? The 21-day EMA currently sits around $62,716, a bit below the current price. If Bitcoin stays above this level, it shows that the bulls are still in control, and the short-term trend is intact. However, if the price falls below this EMA, it’s often a signal that momentum is fading, and we could see further declines toward the support at $60,000.
4. MACD Analysis:
The recent bullish crossover of the MACD line above the signal line indicates that the market has been in an upward trend. However, the shrinking histogram tells us that this upward momentum is weakening.
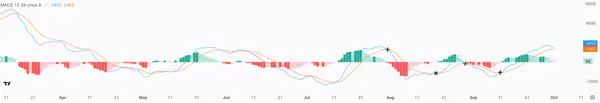
What to Watch: If the MACD line crosses back below the signal line, it would confirm that the current bullish momentum is over and that we may see a shift toward a bearish trend. This would align with a potential retest of support levels, especially if the price drops below the 21-day EMA.
Technical Analysis Key Takeaways
In summary, the technical analysis indicates that Bitcoin is in a short-term uptrend, but it’s facing a key resistance at $65,000. If Bitcoin breaks through this level, we could see further gains toward $70,000. However, weakening momentum in the MACD and the neutral reading in the RSI suggest caution. If Bitcoin drops below the 21-day EMA or if the MACD turns bearish, a retest of the $60,000 support level is likely.
Sentimental Analysis: Fear or Greed?
If you've been around the crypto market for a while, you’ve probably noticed how prices can swing wildly, sometimes just from a single tweet by Elon Musk. It’s not just technicals or fundamentals that move the market—emotions can drive huge price shifts too, especially in something as speculative as Bitcoin. That’s why tools like the Crypto Fear and Greed Index are so useful.
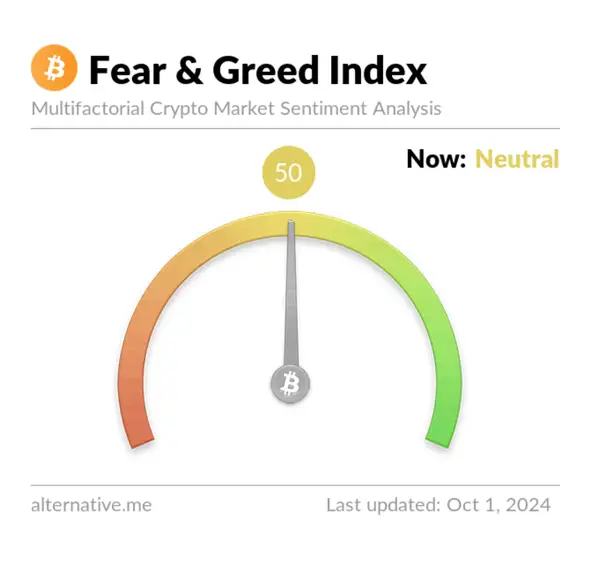
Right now, the Fear and Greed Index is sitting at 50, which tells us that investors are feeling neutral. It’s like the market is in a holding pattern, waiting for something to push it one way or the other. What does that mean for you? It’s a good time to stay alert, neutral markets can flip fast. Whether the next move is driven by fear or excitement, being prepared is key.
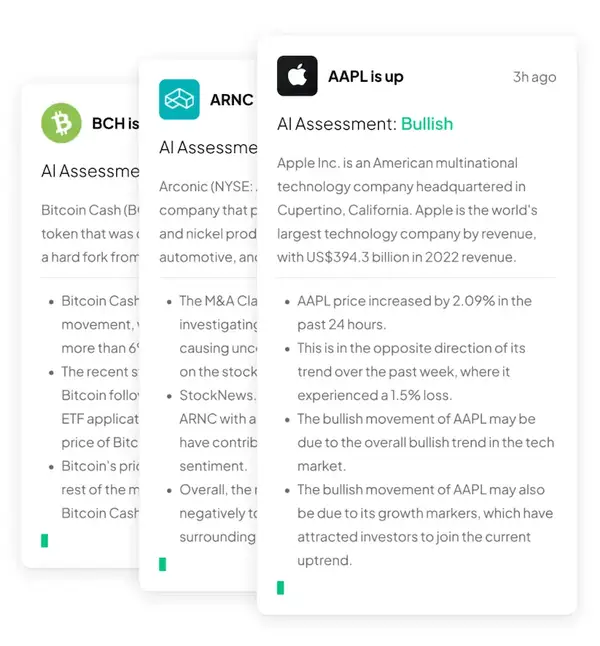
That’s where Morpher AI steps in. Morpher AI doesn’t just track price movements—it digs deeper into market sentiment, volatility, and emerging trends, offering insights that are data-driven. You’ll get real-time updates on what’s moving the market, possible trading signals, and predictive analytics that can help you navigate both the calm and the chaos. Try Morpher AI for real-time market insights!
Final Verdict: Is It the Right Time to Buy Bitcoin?
If you're a long-term investor, Bitcoin's fundamentals make it a solid choice, with future growth driven by scarcity, increasing adoption, and regulatory support. For short-term traders, though, caution is advised. The market is now in a consolidation phase, and technical indicators suggest that you should wait for a clearer breakout or breakdown before entering a position. A breakthrough above $65,000 with strong volume could be a good entry point, but a drop below $60,000 would offer a better buying opportunity.
As always, use Morpher AI’s insights to stay on top of real-time market shifts and sentiment. Whether you're looking to buy into the next bullish trend or waiting for a dip, Morpher AI provides the data you need to make an informed decision in the ever-changing crypto landscape.
Trade BTC on Morpher
1. Create and Verify Your Account
- Sign Up: Visit Morpher.com and create an account.
- Complete KYC: For full access, complete the KYC process by uploading ID and proof of address. This step ensures security and compliance.
2. Deposit Funds
- Choose a Deposit Method: You can deposit Bitcoin, USDC, or other supported payment options such as credit cards or bank transfers.
- Fund Your Account: Follow the deposit instructions to fund your account and prepare to trade.
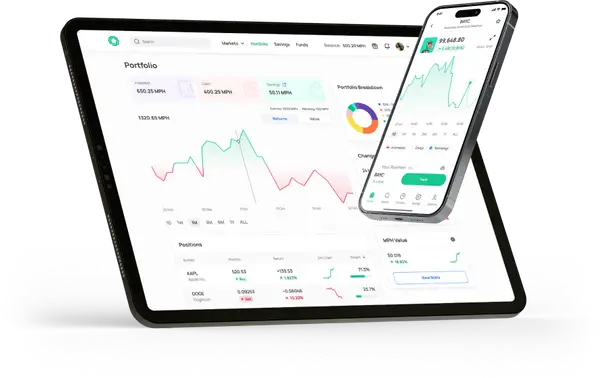
3. Access the Trading Dashboard
- Search for Bitcoin (BTC): Use the search bar or explore markets to select Bitcoin.
- Review the Chart: Study the chart for real-time price movements, apply indicators (e.g., RSI, MA), and choose the appropriate timeframes.
4. Set Price Alerts
- Create Alerts via Mobile App: Set price triggers for Bitcoin. You will be notified when the price reaches your specified levels via email or app notifications.
5. Place a Trade
- Select Buy or Sell: Choose whether you want to go long or short on Bitcoin.
- Enter the Amount: Input how much you want to trade. Morpher allows fractional trading, so you don’t need to buy an entire Bitcoin.
6. Leverage and Risk Management
- Use Leverage (Optional): Morpher allows up to x10 leverage. Be cautious with leverage as it can magnify both gains and losses.
- Set Stop Loss and Take Profit: Protect your trade by setting a Stop Loss to limit potential losses and a Take Profit to lock in gains automatically.
7. Track and Manage Your Trades
- Monitor Open Positions: View and manage your open trades under the Open Positions tab. You can manually close a trade anytime or let your Stop Loss/Take Profit levels close it automatically.
By following these steps, you'll be ready to trade Bitcoin on Morpher. With zero commissions on trades and the ability to buy fractional amounts of Bitcoin, you can start with any budget. Morpher also offers access to a diversified portfolio beyond crypto, including stocks, forex, and more, allowing you to expand your investments across multiple markets. Sign up now and get your Welcome Bonus!

Disclaimer: All investments involve risk, and the past performance of a security, industry, sector, market, financial product, trading strategy, or individual’s trading does not guarantee future results or returns. Investors are fully responsible for any investment decisions they make. Such decisions should be based solely on an evaluation of their financial circumstances, investment objectives, risk tolerance, and liquidity needs. This post does not constitute investment advice.

Painless trading for everyone
Hundreds of markets all in one place - Apple, Bitcoin, Gold, Watches, NFTs, Sneakers and so much more.
Painless trading for everyone
Hundreds of markets all in one place - Apple, Bitcoin, Gold, Watches, NFTs, Sneakers and so much more.