

Welcome to this week's edition of Candlestick Chronicles by Morpher. This week, we take an in-depth look at Bitcoin's performance, one month into the 2024 Halving. With the crypto market heating up due to the SEC's approval of Ethereum ETFs, investors are keenly watching for buying opportunities or signs of market recovery. As the post-halving dynamics unfold, we will explore the key candlestick patterns observed in May 2024 and analyze their implications for Bitcoin's future. Additionally, we'll consider broader market dynamics and how these significant events shape investor sentiment and market behavior.
Key Candlestick Patterns in May 2024
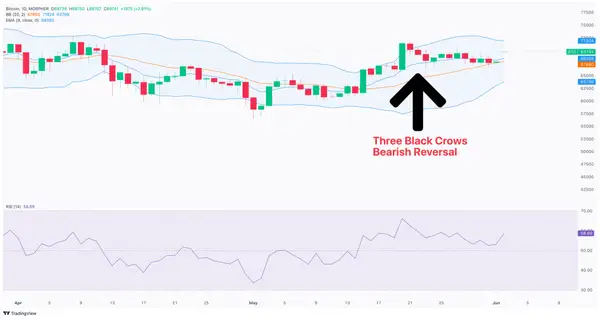
Three Black Crows (May 21 – May 23): A Strong Bearish Reversal
From May 21 to May 23, BTC/USD exhibited the Three Black Crows pattern, characterized by three consecutive long bearish candles. This pattern typically signifies a strong bearish reversal, marking the end of the preceding uptrend. Each candle in this pattern opened within the real body of the previous candle and closed lower, demonstrating the sellers' dominance. This pattern near the upper Bollinger Band added weight to the bearish reversal signal, suggesting traders consider entering short positions or exiting long trades.
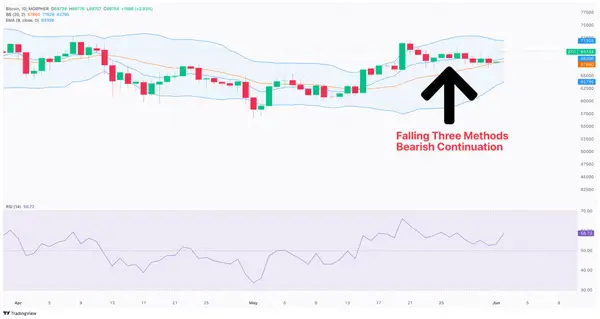
Falling Three Methods (May 26): Bearish Continuation
On May 26, the chart revealed the Falling Three Methods pattern, a bearish continuation pattern. It began with a long red candle, followed by three small green candles (in this case only two visible on chart) within the range of the first red candle, and concluded with another long red candle. This indicated a temporary pause in the downtrend, allowing traders to prepare for further bearish movement. The pattern's confirmation suggested that the bears were firmly in control.
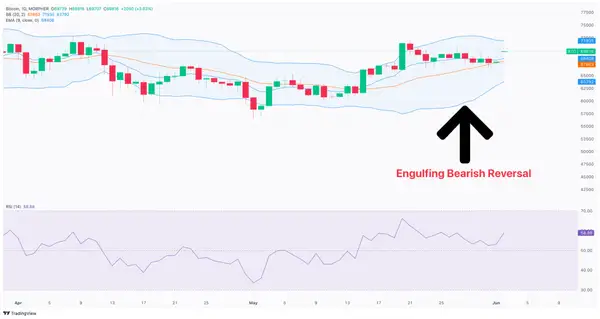
Bearish Engulfing (May 28): Reaffirming the Downtrend
The Bearish Engulfing pattern on May 28 provided another clear signal of bearish dominance. This pattern featured a small green candle followed by a larger red candle that engulfed the green one entirely. The significance of this pattern is heightened after a minor uptrend or consolidation, as it did here, confirming the bearish trend continuation.
Technical Indicators Supporting the Bearish Sentiment
Exponential Moving Average (EMA)
The 9-period EMA was crucial throughout May. Post-May 8, the price action hovered around the EMA before decisively breaking below it during the Three Black Crows pattern, confirming the bearish reversal and providing a dynamic resistance level.
Bollinger Bands
The Bollinger Bands highlighted volatility and potential reversal points. The Three Black Crows pattern formed near the upper Bollinger Band, with the price consistently moving towards the lower band after May 23, indicating sustained bearish momentum. The narrowing of the bands towards the end of May suggested reduced volatility, often a precursor to a significant price move.
Relative Strength Index (RSI)
The RSI supported the bearish outlook. After peaking near 70 in early May, it steadily declined to below 50 by the end of the month, shifting from bullish to bearish territory and confirming the patterns identified on the candlestick chart.
Are you ready to optimize your trading strategy by harnessing the power of candlestick patterns and technical indicators? Morpher's advanced charting tools are here to elevate your trading experience. With access to over 50 technical indicators, including RSI, EMA, and Bollinger Bands, you can precisely interpret market signals and tailor your charts to your specific needs. Experience the fun and effectiveness of technical analysis like never before. Sign up for Morpher today and take your trading to the next level!
Broader Market Dynamics to Take into Account
Post-Halving Environment:
Bitcoin's most recent halving in April 2024 reduced the block reward from 6.25 BTC to 3.125 BTC, significantly impacting market dynamics. Historically, halvings lead to increased scarcity and price appreciation over the long term. The immediate impact can be volatile, but the long-term trend is typically bullish. This structured reduction in block rewards ensures a controlled supply of new coins, adhering to Bitcoin's foundational principle of limited supply, similar to precious metals like gold. The current bearish patterns may represent a healthy correction within a broader upward trajectory. This halving event emphasizes the need for miners to optimize operations and explore alternative revenue streams, such as transaction fees, to maintain profitability.
Approval of Ethereum (ETH) ETFs:
The recent approval of Ethereum ETFs in May 2024 marks a significant milestone for the cryptocurrency market. This development opens doors for institutional investors to gain exposure to ETH, potentially driving higher demand and price appreciation. Regulatory acceptance boosts investor confidence across the crypto market, including Bitcoin. The introduction of regulated investment vehicles like ETFs is expected to attract a broader range of investors, fostering market maturity and stability.
Market Sentiment and Investor Actions:
Recent market activities indicate strong interest in Bitcoin, with significant movements of BTC away from exchanges, suggesting investors are securing their bitcoins in more secure storage in anticipation of a post-halving price increase. High-profile financial analysts have varied expectations post-halving. Some predict significant surges, with forecasts of Bitcoin potentially reaching $200,000 within the next year, while others suggest more conservative movements, expecting prices to stabilize around $42,000. These differing perspectives highlight the uncertainty and speculation surrounding Bitcoin's post-halving trajectory. Additionally, it is notable that the approval of Ethereum ETFs is seen as a bullish indicator for the broader crypto market, reflecting increased institutional adoption and regulatory acceptance.
As we conclude this week's edition of Candlestick Chronicles, it is evident that May 2024 has been a month to remember for Bitcoin. The key candlestick patterns indicate a strong bearish sentiment that has dominated the market. These patterns, supported by technical indicators like the 9-period EMA, Bollinger Bands, and RSI, confirm the prevailing bearish outlook. Given the various market forces and uncertainties surrounding Bitcoin, we need to watch how the market evolves.
To stay ahead of the market trends and capitalize on these insights, start trading on Morpher. With our advanced trading platform, you can leverage these technical and market dynamics to make informed decisions and optimize your trading strategies. Sign up for Morpher today and enhance your trading experience with our cutting-edge tools.

Disclaimer: All investments involve risk, and the past performance of a security, industry, sector, market, financial product, trading strategy, or individual’s trading does not guarantee future results or returns. Investors are fully responsible for any investment decisions they make. Such decisions should be based solely on an evaluation of their financial circumstances, investment objectives, risk tolerance, and liquidity needs. This post does not constitute investment advice.

Painless trading for everyone
Hundreds of markets all in one place - Apple, Bitcoin, Gold, Watches, NFTs, Sneakers and so much more.
Painless trading for everyone
Hundreds of markets all in one place - Apple, Bitcoin, Gold, Watches, NFTs, Sneakers and so much more.