We've extensively covered the fundamentals of candlestick patterns, here at Morpher, exploring how they can provide key insights into market sentiment and trading opportunities. But understanding candlestick patterns is just the beginning. For traders looking to gain an edge in the fast-paced world of crypto, it’s essential to dive deeper into how these patterns actually play out in live markets.
In this guide, we’re not just explaining candlestick patterns—we’re showing how to use them. From identifying the most common patterns in crypto charts to understanding the critical signals they send, this article is designed to be a practical, easy-to-follow handbook for both beginners and seasoned traders alike.
What Are Candlestick Patterns?
Candlestick patterns represent the price movement of an asset over a certain period. Each candlestick shows four crucial price points: open, close, high, and low. These patterns help traders predict future market movements based on historical data.
Candlestick charts are particularly useful in crypto markets, where price fluctuations can be rapid. These patterns reflect the emotional and psychological state of the market, often driven by fear or greed. Traders use these visual indicators to identify potential reversals or continuations of trends.
For a more in-depth explanation, refer to our popular Candlestick Patterns Guide 2024, where we cover the history, types, and detailed analysis of each pattern.
Top Candlestick Patterns in Crypto Trading
Now that we understand the importance of candlestick patterns, let's explore some of the most popular ones in the world of crypto trading.
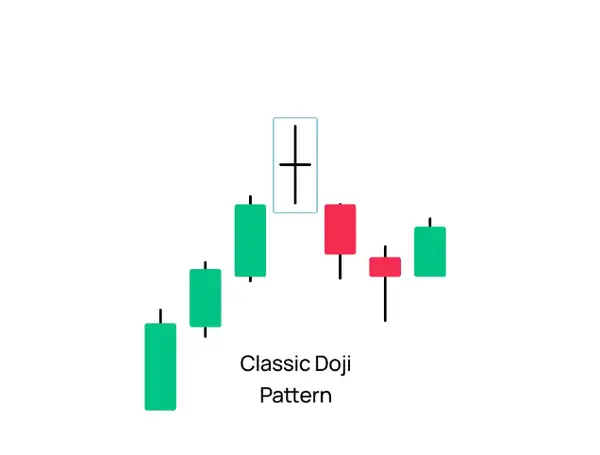
The Doji: A Sign of Market Indecision
The Doji is a candlestick pattern that reflects indecision in the market. It occurs when the opening and closing prices are nearly identical, resulting in a very small body with long wicks on either side. This pattern indicates that neither buyers nor sellers are in control, which often precedes a significant move in either direction.
When It Appears: Doji patterns typically appear in periods of market uncertainty or when the market is about to change direction.
What It Signals: The Doji suggests a period of indecision, hinting that a reversal or strong continuation could follow. Traders often wait for confirmation from subsequent candlesticks before making a move.
How to Trade: After spotting a Doji, it’s wise to wait for confirmation in the following candles. If the next candle is bullish, it signals upward momentum, whereas a bearish candle may indicate a downward move.
The Hammer and Hanging Man: Indicators of Reversals
A Hammer is a bullish reversal pattern that appears after a downtrend. It has a small body and a long lower wick, suggesting that sellers pushed the price down significantly, but buyers stepped in to drive the price back up before the close. Conversely, a Hanging Man occurs at the top of an uptrend and signifies a potential reversal to a downtrend.
When It Appears: The Hammer usually forms at the bottom of a downtrend and signals a potential reversal.
What It Signals: The pattern indicates that the market may be shifting from selling pressure to buying interest, with buyers taking control.
How to Trade: When a Hammer appears after a downtrend, traders often look for confirmation in the form of a bullish candle following it. Entering long positions after this confirmation can be an effective strategy.
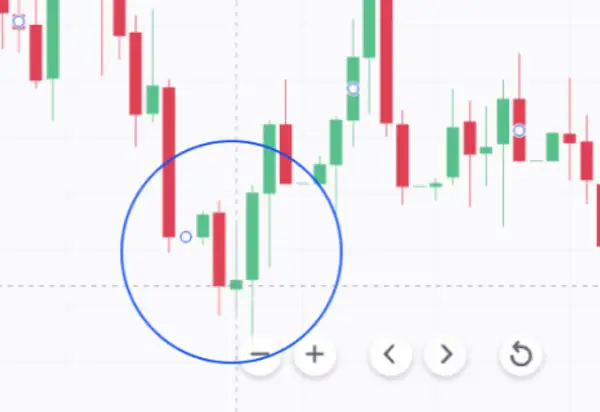
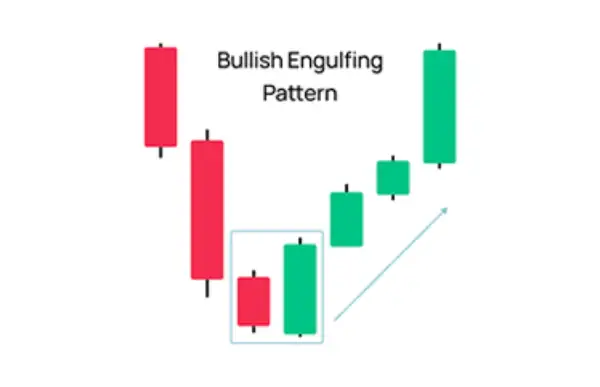
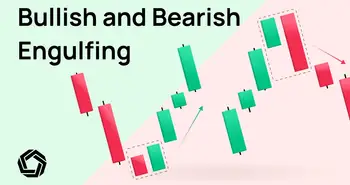
Bullish Engulfing: The Power Shift
A Bullish Engulfing pattern consists of two candles: the first is a small bearish candle, and the second is a larger bullish candle that engulfs the previous one. This pattern signifies that buyers have overwhelmed sellers, which often leads to upward momentum.
When It Appears: This pattern typically appears at the bottom of a downtrend or during a consolidation period.
What It Signals: It signals strong buyer interest, often leading to a potential uptrend.
How to Trade: Traders usually enter long positions when the price breaks above the bullish candle's high, setting stop-loss orders below the previous candle's low.
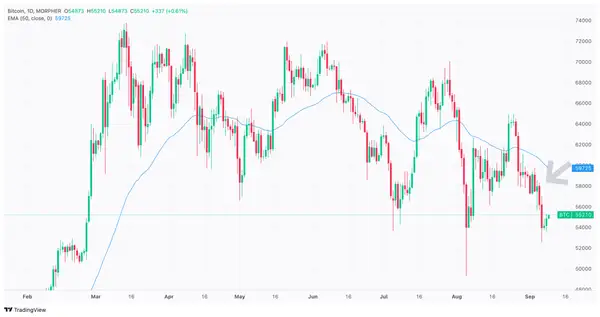
Most Popular Bearish Signals in Crypto: Bearish Engulfing
The Bearish Engulfing pattern occurs after an uptrend, where a large bearish candle engulfs a smaller bullish candle. This signals that sellers have taken over, and a downtrend may follow.
When It Appears: Bearish Engulfing patterns typically emerge at the top of an uptrend or in overbought conditions.
What It Signals: It indicates a strong shift in momentum from buyers to sellers, marking a potential reversal.
How to Trade: Traders often enter short positions when the price breaks below the low of the bearish candle. Stop-loss orders can be placed above the high of the engulfed candle for risk management.
Case Study: On September 5, 2024, Bitcoin showed a Bearish Engulfing pattern after a brief rally. Traders who recognized this pattern and entered short positions capitalized on the following price drop.
Most Popular Bullish Signals in Crypto: Morning Star
The Morning Star and Evening Star Patterns are complex candlestick patterns that indicate potential trend reversals. The morning star pattern consists of three candles: a bearish candle, a small indecision candle, and a bullish candle. It suggests a reversal from a downtrend to an uptrend.
The evening star pattern, on the other hand, is the opposite of the morning star and suggests a reversal from an uptrend to a downtrend. These patterns provide traders with strong signals of trend reversals and can help guide their trading decisions.
The Most Recent Patterns: Three Black Crows and Three White Soldiers
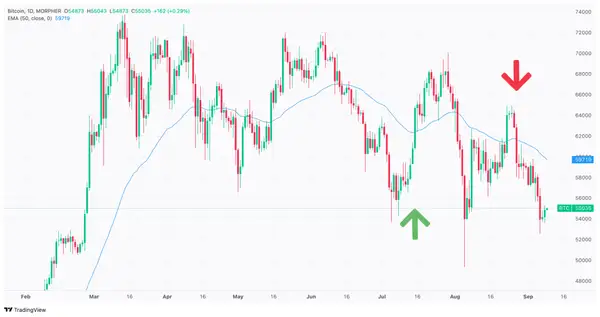
Three White Soldiers
This bullish pattern is characterized by three consecutive long green (bullish) candlesticks that open within the previous candle's body and close progressively higher. I see a potential Three White Soldiers formation around July 16-18, 2024. During this period, there are three green candles that indicate a strong upward reversal after a prior downtrend.
Three Black Crows
This bearish pattern consists of three consecutive long red (bearish) candlesticks with each opening within the previous candle’s body and closing progressively lower. On your chart, between August 25-28, 2024, you can spot a sequence of three red candles that fit the description of the Three Black Crows. This would indicate a potential reversal from the prior uptrend.
Strategies for Trading with Candlestick Patterns
Now that we have explored various candlestick patterns, let's discuss some strategies for trading with them.
Combining Candlestick Patterns with Technical Analysis
One effective strategy is to combine candlestick patterns with technical analysis indicators, such as moving averages, oscillators, or trend lines. This combination can provide a more comprehensive view of the market and increase the probability of making accurate trading decisions.
For example, if a bullish engulfing pattern occurs near a major support level or a rising trend line, it strengthens the bullish signal and provides further confirmation for traders to enter a long position.
Timing Trades with Candlestick Patterns
Another strategy is to use candlestick patterns to time trades effectively. By waiting for confirmation from multiple patterns or combining them with other technical analysis tools, traders can improve the timing of their entry and exit points.
For instance, if a bearish engulfing pattern occurs after a series of doji candles near a significant resistance level, it may indicate a high probability of a price reversal. Traders can then use this information to enter a short position and ride the downward movement.
As an expert in crypto trading, I have witnessed firsthand the power of candlestick patterns in analyzing markets and improving trading outcomes. One personal piece of advice I would give to fellow traders is to practice patience and discipline when using candlestick patterns. It's important not to rely solely on one pattern but instead use a combination of indicators to increase the likelihood of success.
When I first started trading crypto, I made the mistake of placing too much emphasis on individual candlestick patterns without considering other factors. It's crucial to remember that no single pattern guarantees success, and proper risk management should always be a priority.
FAQs
Q: Why are candlestick patterns important in crypto trading?
A: Candlestick patterns are important in crypto trading because they provide valuable insights into market sentiment and help predict future price movements. By understanding these patterns, traders can make more informed decisions and increase their profitability.
Q: What are some popular candlestick patterns in crypto trading?
A: Some popular candlestick patterns in crypto trading include the doji, hammer, hanging man, bullish engulfing, bearish engulfing, morning star, evening star, three black crows, and three white soldiers. These patterns offer valuable signals for potential trend reversals and continuation patterns.
Q: How can I use candlestick patterns effectively in my trading strategy?
A: To use candlestick patterns effectively, it's important to combine them with other technical analysis tools, such as moving averages, trend lines, and oscillators. This comprehensive approach improves the accuracy of trading decisions and helps to identify high-probability trading opportunities.
Q: What is the most common mistake traders make when using candlestick patterns?
A: One common mistake traders make when using candlestick patterns is relying solely on one pattern without considering other factors. It's crucial to use a combination of indicators and exercise proper risk management to maximize trading success.
Q: How can I improve my skills in interpreting candlestick patterns?
A: Improving skills in interpreting candlestick patterns requires practice and continued learning. Traders can read books, attend webinars, and analyze historical price data to enhance their understanding of candlestick patterns and their applications in different market conditions.
By incorporating these popular candlestick patterns into your trading arsenal and understanding their significance, you can gain a competitive edge in the world of crypto trading. Remember, knowledge and experience are key, so keep learning, stay disciplined, and approach every trade with a strategic mindset. Happy trading!
Ready to put your knowledge of candlestick patterns to the test in the dynamic world of crypto trading? Look no further than Morpher, the revolutionary trading platform that leverages blockchain technology to offer you a seamless, zero-fee trading experience across a multitude of asset classes. With Morpher, you can trade with infinite liquidity, engage in fractional investing, and even short sell without interest fees. Plus, with up to 10x leverage and the safety of a non-custodial wallet, you're in full control of your trading journey. Embrace the future of investing with Morpher's unique trading experience. Sign Up and Get Your Free Sign Up Bonus today, and start trading with the edge you've been looking for.
Disclaimer: All investments involve risk, and the past performance of a security, industry, sector, market, financial product, trading strategy, or individual’s trading does not guarantee future results or returns. Investors are fully responsible for any investment decisions they make. Such decisions should be based solely on an evaluation of their financial circumstances, investment objectives, risk tolerance, and liquidity needs. This post does not constitute investment advice.
Painless trading for everyone
Hundreds of markets all in one place - Apple, Bitcoin, Gold, Watches, NFTs, Sneakers and so much more.
Painless trading for everyone
Hundreds of markets all in one place - Apple, Bitcoin, Gold, Watches, NFTs, Sneakers and so much more.
Subscribe now to our newsletter to get critical insights and analysis: