
This week, we're diving into the electrifying world of Tesla Inc. (TSLA), where innovation meets market volatility. Tesla, a pioneer in electric vehicles and sustainable energy, has always been a stock to watch. As market sentiment fluctuates, understanding the nuances of its stock movements is more important than ever.
Let's uncover the latest candlestick patterns, interpret their significance, and equip you with actionable insights to navigate the market.
Doji Bearish Reversal (May 30, 2024)
Pattern Overview: The Doji pattern signals market indecision. It forms when the open and close prices are nearly equal, resulting in a small body with long wicks. This often occurs at market turning points, especially after a strong uptrend.
Implications for TSLA: The Doji pattern on May 30 suggested a potential end to the prevailing uptrend, hinting at a bearish reversal. Traders were advised to watch for further bearish signals before making decisions.
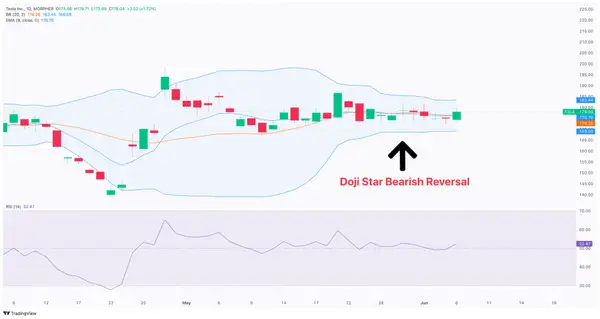
Evening Doji Star Bearish Reversal (May 31, 2024)

Pattern Overview:
The Evening Doji Star is a three-candle pattern that indicates a bearish reversal. It begins with a bullish candle, followed by a Doji, and concludes with a bearish candle. The Doji reflects market indecision, and the bearish candle confirms the shift in sentiment.
Formation and Characteristics:
- First Candle: A large bullish (green) candle that signifies strong buying momentum.
- Second Candle (Doji): The Doji opens above the close of the first candle and closes near its open price, indicating indecision and a potential shift in market sentiment. The Doji for TSLA on May 30, 2024, had a high of 186.57 and a low of 182.29, closing at 184.43.
- Third Candle: A bearish (red) candle that opens below the Doji and closes near the midpoint of the first candle, confirming the reversal. On May 31, 2024, this candle opened at 184.43 and closed at 179.88, marking the shift in momentum from buyers to sellers.
Significance for TSLA:
The Evening Doji Star pattern on May 31 was a strong indicator of a bearish reversal. This pattern, especially significant due to its reliability, suggested that the upward momentum was losing steam and sellers were gaining control. This pattern marked a critical point for traders to consider exiting long positions or preparing for potential short opportunities.
Technical Indicators Supporting the Bearish Sentiment
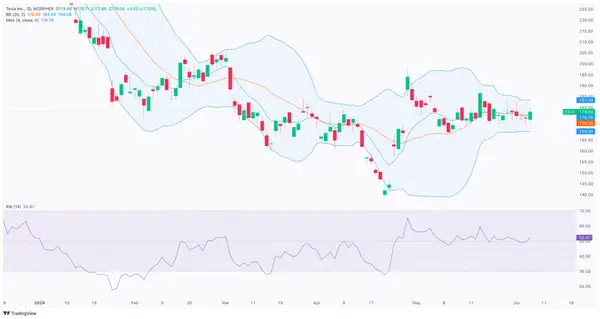
- Exponential Moving Average (EMA): The 9-period EMA provided a dynamic resistance level throughout early June. The price action around this EMA confirmed the bearish reversal, with Tesla's stock moving below the EMA after the Evening Doji Star pattern.
- Bollinger Bands: The Bollinger Bands highlighted increased volatility. The bearish patterns emerged near the middle band, with the price potentially moving towards the lower band, indicating a sustained bearish momentum.
- Relative Strength Index(RSI): The RSI, which hovered around 52.47, supported the bearish outlook. A decline in RSI below 50 would further confirm the bearish trend, indicating that the stock is entering oversold territory.
Current Market Dynamics for Tesla
Recent developments that could impact Tesla's share price include:
Annual Meeting of Stockholders: Scheduled for June 13, 2024, this meeting will address several key proposals, including the re-election of directors and a potential move of Tesla's state of incorporation from Delaware to Texas. Significant corporate decisions made during this meeting could influence stock prices.
Analyst Outlooks and Challenges: Analysts have highlighted challenges for Tesla in 2024 and 2025, including slower growth, high interest rates, and competition in China considering the electric vehicles industry. Despite these headwinds, long-term optimism remains due to the potential of Tesla's Full Self-Driving (FSD) software, which could significantly boost margins in the future.
Recent Earnings and Market Reactions: Tesla's recent earnings missed analyst forecasts, leading to mixed reactions in the stock market. While positive developments like regulatory approval for FSD in China provided short-term boosts, underlying challenges continue to exert downward pressure on the stocks.
The Evening Doji Star pattern observed in Tesla's stock is a significant bearish signal. Traders should consider this pattern alongside other technical indicators and market dynamics. This week's analysis suggests potential bearish movement for Tesla, and traders are advised to monitor further developments closely. Stay tuned for more updates and detailed analysis in the next edition of the Weekly Candlestick Chronicles.
If you're ready to navigate the volatility of TSLA shares and position yourself according to the latest market dynamics, we invite you to join Morpher. With Morpher, you can trade all US stocks, including Tesla, with zero commissions. Take advantage of our platform to open short or long positions based on the latest TESLA market signals. Whether you are looking to capitalize on bearish trends or seek opportunities in bullish markets, Morpher provides the tools and insights you need to succeed. Start trading on Morpher today and gain the edge in the stock market.

Disclaimer: All investments involve risk, and the past performance of a security, industry, sector, market, financial product, trading strategy, or individual’s trading does not guarantee future results or returns. Investors are fully responsible for any investment decisions they make. Such decisions should be based solely on an evaluation of their financial circumstances, investment objectives, risk tolerance, and liquidity needs. This post does not constitute investment advice.

Painless trading for everyone
Hundreds of markets all in one place - Apple, Bitcoin, Gold, Watches, NFTs, Sneakers and so much more.
Painless trading for everyone
Hundreds of markets all in one place - Apple, Bitcoin, Gold, Watches, NFTs, Sneakers and so much more.