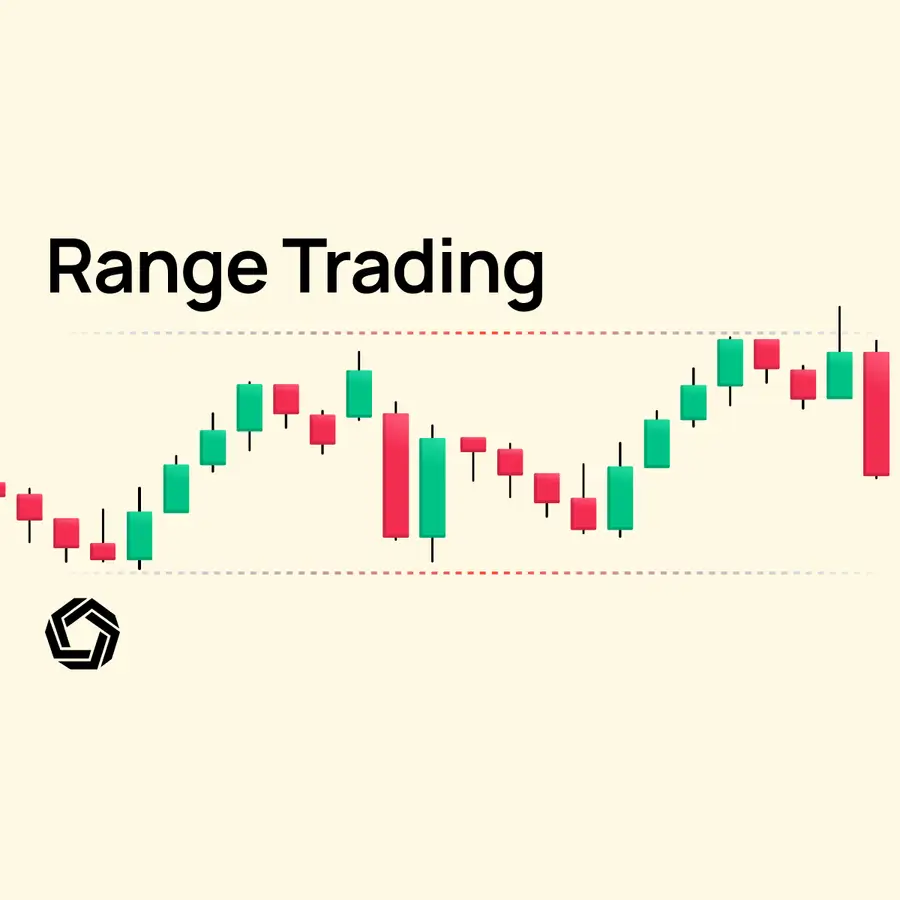
Just like a tightrope walker balances with precision, range traders excel in markets that lack a clear trend, instead moving within a defined price range. In this guide, we'll explore the fundamentals of range trading, drawing inspiration from trading virtuosos like Linda Bradford Raschke and Paul Tudor Jones, who have mastered the art of profiting in markets that others may find directionless.
An Introduction to Range Trading
Range trading, at its core, involves identifying stocks or securities that fluctuate within a specific price range. This is similar to predicting the highest and lowest scores in a series of basketball games; traders aim to buy low at the support level and sell high at the resistance level.
Imagine you're observing a game where the scores consistently fall between 80-100 points. As a range trader, you'd bet on the scores staying within this range, capitalizing on the predictability of this pattern.
Key Indicators and Strategies in Range Trading
Range traders use a variety of technical indicators to identify and capitalize on range-bound markets. Some of the key tools and strategies include:
Horizontal Support and Resistance Levels: Identifying clear support and resistance levels is crucial in range trading. These are the levels where the price has historically reversed.
Bollinger Bands: This indicator consists of a moving average (typically the 20-day MA) and two standard deviation lines (bands) above and below it. Traders look for prices touching or approaching these bands as potential reversal points within the range.
Oscillators: Tools like the Stochastic Oscillator or the Relative Strength Index (RSI) are vital in range trading. They help identify overbought and oversold conditions, signaling potential reversal points at the range's boundaries.
Price Action: Understanding candlestick patterns and other price action signals can provide additional confirmation for range-bound trade setups.
The section ahead will detail three range trading strategies, differentiated by their respective settings, indicators, and market approach. The same market segment will serve as the basis for demonstrating each strategy's application. The comparison aims to delineate the distinctive operational aspects of these strategies and their potential adjustment for effective range trading.
The information provided is structured to enhance the reader's understanding of how each strategy functions within a given market range. The objective is to present a clear framework for each method, facilitating an informed choice regarding strategy selection based on individual trading preferences and market analysis.
The content focuses on presenting the factual aspects of range trading, emphasizing the mechanics and technical considerations inherent to each strategy without subjective assessment.
Already comfortable with the basics? Head over to Range Trading 102for deeper insights and advanced strategies that can fine-tune your approach and help you grow as a trader.
Classic Range Trading with Support and Resistance
The Support and Resistance Range Trading strategy is designed to capitalize on price movements within defined boundaries, known as support and resistance levels. This approach works best in markets where prices fluctuate consistently between these levels, without forming a clear trend.
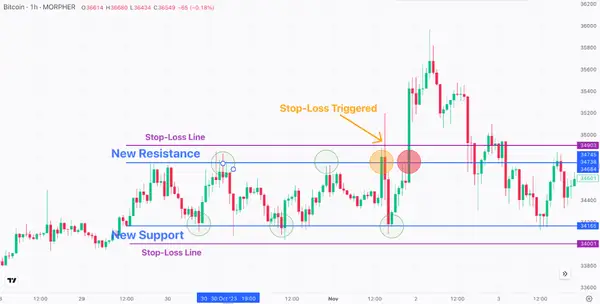
Step 1: Find Support and Resistance Levels Support is the price level where the market typically reverses upward, forming a ‘floor.' Resistance is the level where price tends to reverse downward, acting as a ‘ceiling.' Analyze the chart to find these levels—look for historical price points where the market has repeatedly bounced off or retreated from. These levels create a horizontal range where price movement is likely to oscillate.
Step 2: Execute Trades Buy Orders: Enter a buy position when the price touches or approaches the support level. These points, often highlighted on the chart (green circles), indicate where market sentiment has historically pushed the price upward. Sell or Short Orders: Consider selling or shorting when the price nears the resistance level, as this is where the price has encountered downward pressure in the past.
Step 3: Manage Risk with Stop-Loss Orders
For buy orders, place a stop-loss just below the support level.
For sell orders, place a stop-loss just above the resistance level.
In the chart, an orange circle shows a stop-loss trigger point, signaling that price movement has broken out of the expected range and invalidated the trade setup.
Step 4: Set Realistic Profit Targets Set profit targets slightly before the price reaches the opposite boundary of the range. This reduces the risk of price reversals before reaching support or resistance levels.
The red circle on the chart marks a breakout point, where price moves beyond the established range, indicating a potential end to range-bound trading conditions.
Classic Range Trading with Support and Resistance Rules
Chart Timeframe: Use a 1-hour chart to find the range and make precise entries and exits.
Range Identification: Set up the support and resistance levels based on historical price reversals.
Entry Points: Buy near support and sell near resistance, using candlestick patterns or other indicators for extra entry confirmation.
Volume Analysis: Watch volume to gauge the strength of the price movement at the range’s boundaries. Low volume at these points shows weak support or resistance.
Stop-Loss Orders: Place stop-loss orders outside the identified range to minimize potential losses from unexpected breakouts.
Profit Targets: Set profit targets within the range, below resistance for sell orders and above support for buy orders.
Monitoring: Watch for signs of a breakout from the range, which would invalidate the current strategy.
Adaptability: Be prepared to adapt the strategy if the market exits the range-bound state and begins to trend.
Want to master range trading with precision? Morpher AI offers real-time insights that adapt to your strategies, helping you pinpoint support and resistance levels with ease. By analyzing market trends and volatility in real time, Morpher AI gives you the edge in identifying optimal entry and exit points within a range. Let AI handle the heavy lifting, so you can focus on making smarter, more profitable trades. Discover Morpher AI now!
Range Trading with Bollinger Band
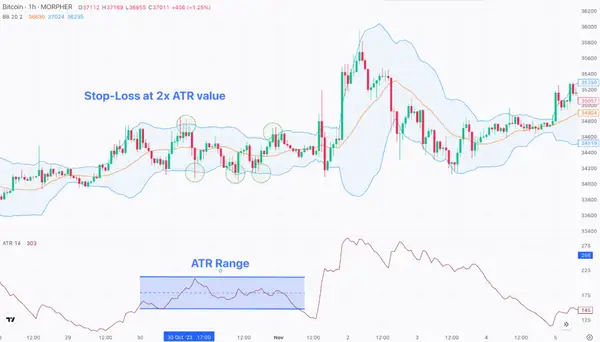
The “Bollinger Bands and ATR Range Trading” strategy combines Bollinger Bands for identifying the trading range with the Average True Range (ATR) for setting stop-loss orders and determining the stability of the range.
Why Use Bollinger Bands with ATR for Range Trading?
Bollinger Bands: These provide dynamic support and resistance levels that adjust according to market volatility, helping to define potential trading ranges.
ATR (Average True Range): ATR measures market volatility, assisting in setting appropriate stop-losses and signaling when the market exits a range-bound state.
A stable range is confirmed when the Bollinger Bands move in parallel, and the ATR remains flat, indicating steady volatility. In the chart, the blue corridor shows the identified range on the lower half of the chart. If the ATR breaks out of its range, this suggests a shift in market conditions, and range trading should be stopped.
Key Steps in the Bollinger Bands and ATR Strategy
Buying Opportunities: Enter a buy position when the price touches the lower Bollinger Band and turns upward. Selling or Shorting Opportunities: Enter a sell or short position when the price reaches the upper Bollinger Band and begins to reverse.
Setting Stop-Loss Orders:Place stop-losses at a distance of 2x the value of the ATR from your entry point. This allows room for the trade to withstand normal market fluctuations as indicated by the ATR. In the provided chart, you can see that stop-losses were not triggered while trading within the Bollinger Bands, showcasing the effectiveness of using ATR to manage risk.
Exiting a Trade: For long positions, exit when the price nears the middle SMA or the upper Bollinger Band. For short positions, exit when the price approaches the middle SMA or the lower Bollinger Band.
Range Trading with Bollinger Band Rules
Chart Timeframe: Use a 1-hour chart to watch the interaction between price and Bollinger Bands, and to check the ATR.
Bollinger Band Settings: Use the standard 20-period SMA and 2 standard deviations.
ATR Settings: Set the ATR period to 14, which is standard, to assess the market volatility.
Entry Points: Confirm entries with the price touching Bollinger Bands and extra indicators like RSI for overbought/oversold signals.
Volume Analysis: Use volume to confirm the strength of the signals at the Bollinger Bands' extremes.
Stop-Loss Orders: Calculate stop-loss based on 2x the ATR value from the entry point to accommodate the volatility indicated by the ATR.
Profit Targets: Set profit targets within the range, ensuring to exit before the price can potentially reverse at the SMA.
Position Sizing: Risk a defined percentage of the trading capital to keep risk under control.
ATR Range: Cease trading if the ATR indicates a breakout from its normal range, signaling a possible end to range-bound conditions.
Adaptability: Be ready to adapt or cease the strategy if the market shows signs of entering a trend, as indicated by a changing ATR.
The integration of Bollinger Bands with ATR refines the range trading strategy, allowing for dynamic and responsive stop-loss placements and a clear sign of when to exit the range trading approach. This strategy is particularly suited for markets with consistent volatility, as the ATR provides a real-time volatility gauge, enhancing decision-making in entry and exit points and risk management.
Range Trading Using Oscillators and Indicators
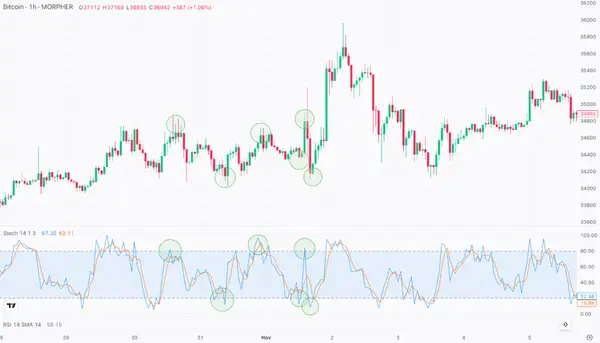
The “Stochastic Oscillator Range Trading” strategy leverages the Stochastic Oscillator, a momentum indicator that compares a particular closing price of an asset to a range of its prices over a certain period of time. The sensitivity of the oscillator to market movements makes it ideal for identifying entry and exit points within a range.
Key Steps in the Stochastic Oscillator Range Trading Strategy Buy Signal: A buy signal is generated when the Stochastic Oscillator falls below 20 (oversold) and crosses back above this level. This indicates a potential upward reversal, as shown by the green circles on the chart. Sell Signal: A sell signal occurs when the Stochastic Oscillator rises above 80 (overbought) and then crosses back below, signaling a downward reversal. Trading Frequency: Unlike other range trading strategies that involve fewer trades, the Stochastic Oscillator strategy capitalizes on frequent momentum swings within the range, leading to more frequent trades. Holding Periods: Positions are often held longer, waiting for the full oscillation between overbought and oversold conditions to maximize gains. Stop-Loss Orders: Set stop-losses approximately 1% outside the identified range to protect against potential breakouts. This helps reduce risk if the price moves against the anticipated range behavior. Take-Profit Orders: Place take-profit orders near the opposite boundary of the range or when the Stochastic Oscillator signals an exit.
Range Trading Using Oscillators and Indicators Rules
Chart Timeframe: Use a 1-hour chart to watch the Stochastic Oscillator movements about price action.
Stochastic Settings: A typical setting is 14 periods for %K and 3 periods for %D.
Entry Points: Enter trades based on crossovers of the %K and %D lines along with oversold and overbought levels.
Volume Confirmation: Confirm entries with volume analysis, ensuring that market entry and exit points are supported by trading volume.
Monitoring: Regularly review the Stochastic Oscillator for continued validity of the range and exit promptly if there's evidence of a breakout.
Adaptability: Stay flexible and ready to exit trades if the market shows signs of transitioning into a trending phase, as indicated by sustained moves beyond the 20 or 80 levels.
Psychological Aspects of Range Trading
Emotional Discipline Required for Range Trading
Range trading necessitates strict adherence to established rules, challenging traders to overcome instinctual responses. Jesse Livermore, a notable figure in trading history, stated, “The human side of every person is the greatest enemy of the average investor or speculator.” Success in this strategy hinges on the ability to forgo impulsive actions driven by greed or fear. For example, a trader who sets a buy order at $50 and a sell target at $55 must keep this strategy, regardless of whether the market value unexpectedly climbs to $56.
Overcoming the Temptation to Trade Outside the Range
The challenge in range trading lies not only in identifying the range but also in resisting the temptation to trade when prices are outside of this range. As billionaire hedge fund manager Ray Dalio advises, “You have to be an independent thinker in markets to be successful because the consensus is baked into the price.” This means that even if there is a buzz around a stock that's now at $100, well above the identified range high of $90, a disciplined range trader should refrain from buying, recognizing that the potential for a reversal is high.
The Psychological Pitfalls of Breakouts and Fakeouts
Breakouts and fakeouts can trigger emotional responses that lead to hasty decisions. Market expert Alexander Elder noted, “The goal of a successful trader is to make the best trades. Money is secondary.” This highlights the importance of not chasing profits during a breakout or panicking during a fakeout. For instance, if a currency pair typically trades between 1.1200 and 1.1300 and suddenly spikes to 1.1350, a disciplined trader would wait for confirmation of a true breakout rather than reacting to the first move.
Practical Tips for Effective Range Trading
Best Times for Range Trading (Low Volatility Periods)
The most opportune times for range trading are typically during low volatility periods when prices move sideways. According to market timing expert Linda Bradford Raschke, “There are times to go long, times to go short, and times to go fishing.” For example, the Forex market often experiences lower volatility during the mid-session hours after London's morning session but before New York's session begins, which show stable range-bound conditions.
Asset Choice for Range Trading (Currency Pairs, Stocks, Commodities)
Selecting the right asset is crucial for range trading. Currency pairs like EUR/CHF and USD/JPY have historically exhibited range-bound characteristics due to economic policies that tend to stabilize these currencies. Similarly, some stocks tend to trade in ranges due to consistent business performance without significant growth or declines. Conversely, commodities can be more volatile and less suited to range trading unless during periods of market equilibrium.
The Role of News and Economic Events in Range Trading
News and economic events can disrupt a trading range, so it's essential to be aware of the economic calendar. Experienced trader John Murphy asserts, “The most significant currency moves usually occur when unexpected events happen.” For example, a surprise interest rate hike can cause an immediate breakout of a currency pair from its range.
Conclusion
Diligent record-keeping and regular trade review are fundamental for iterative refinement of range trading strategies. Echoing the sentiment of trading psychology expert Dr. Van K. Tharp, “Good records make good traders,” the act of recording the specifics of each trade enables the dissection of one's trading patterns. For example, a trader who consistently captures gains in a stock trading between $10 and $15 can leverage this historical data to fine-tune approaches for future similar market conditions.
The article has presented three distinct methodologies: classic support and resistance, Bollinger Bands with ATR, and the Stochastic Oscillator. Each requires a disciplined adherence to its guidelines, and just as Matt Levine wryly notes, sometimes the market is less a wild casino and more a ledger demanding meticulous bookkeeping.
Support and resistance trading operates on the principle of transactional clarity, with entries and exits executed at established price thresholds. The Bollinger Bands with ATR strategy introduces a dynamic part, calibrating trades to current market volatility. The Stochastic Oscillator approach caters to traders seeking higher frequency activity, exploiting rapid price shifts and extended trade durations.
Traders must use restraint, particularly in range trading, to avoid reactionary measures prompted by market chatter or unforeseen news. Such discipline, coupled with a robust log of trades, paves the way for continual strategy enhancement and, ultimately, steady performance in the often unpredictable markets. Thus, range trading stands as a testament to the power of a methodical and analytical approach to the markets.
Disclaimer: All investments involve risk, and the past performance of a security, industry, sector, market, financial product, trading strategy, or individual’s trading does not guarantee future results or returns. Investors are fully responsible for any investment decisions they make. Such decisions should be based solely on an evaluation of their financial circumstances, investment objectives, risk tolerance, and liquidity needs. This post does not constitute investment advice.
Painless trading for everyone
Hundreds of markets all in one place - Apple, Bitcoin, Gold, Watches, NFTs, Sneakers and so much more.
Painless trading for everyone
Hundreds of markets all in one place - Apple, Bitcoin, Gold, Watches, NFTs, Sneakers and so much more.
Subscribe now to our newsletter to get critical insights and analysis: