
The Average Directional Index (ADX) is a powerful technical indicator that can help traders identify the strength of a trend and determine potential entry and exit points in the market. In this article, I will guide you through the different aspects of the ADX and show you how to effectively use it in your trading strategies.
Introduction to the Average Directional Index (ADX)
If you are new to technical analysis, the ADX might seem unfamiliar to you. However, once you understand its underlying concept and how it works, you will realize its value in assessing the strength of a trend. The ADX is part of the wider family of indicators developed by J. Welles Wilder Jr., who created the concept of Directional Movement.
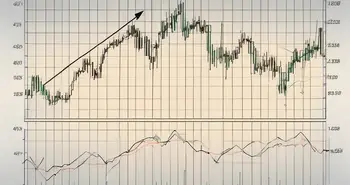
To put it simply, the ADX measures the strength of a trend and not its direction. It consists of a single line plotted on a chart, ranging from 0 to 100. The higher the ADX reading, the stronger the trend, and vice versa.
The Concept Behind ADX
The ADX calculates the difference between two key indicators, the Positive Directional Indicator (+DI) and the Negative Directional Indicator (-DI). It then smooths the result over a specified period. The ADX line is plotted by taking the smoothed result of the difference between the +DI and -DI indicators.
By analyzing the ADX line, traders can gain insight into the strength of a trend and determine whether it is worth entering or exiting a position.
Importance of ADX in Trading
The ADX has numerous applications in trading strategies. A high ADX reading suggests a strong uptrend or downtrend, indicating that it might be an opportune time to ride the trend and maximize profits. Conversely, a low ADX reading indicates a weak trend, signaling that it may not be the best time to enter the market.
Additionally, the ADX can help traders identify potential trend reversals and avoid false signals. When the ADX starts to decline after reaching a high level, it may indicate that the current trend is losing momentum, allowing traders to prepare for a possible trend reversal.
Components of the Average Directional Index
Positive Directional Indicator (+DI)
The +DI is one of the components used in calculating the ADX. It measures the upward movement in price and provides insight into bullish strength. When the +DI line is above the -DI line, it indicates that buyers are in control and that the trend is likely to continue upward.
By tracking the +DI, traders can stay ahead of the game and take advantage of potential bullish opportunities.
Negative Directional Indicator (-DI)
The -DI, on the other hand, measures the downward movement in price and reflects bearish strength. When the -DI line is above the +DI line, it suggests that sellers are taking control and that the trend is likely to continue downward.
Keeping an eye on the -DI can help traders identify potential bearish opportunities and plan their trades accordingly.
Interpreting the Average Directional Index
Understanding ADX Values
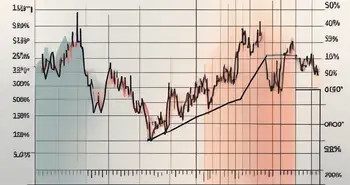
Interpreting ADX values can be a bit tricky, but it becomes easier with practice. Generally, an ADX reading below 20 indicates a weak trend, while an ADX reading above 50 suggests a strong trend. ADX readings between 20 and 50 fall into the intermediate category, indicating a moderately strong trend.
However, it is important to note that ADX values alone do not provide a complete picture. They should be used in conjunction with other technical indicators and chart patterns to make informed trading decisions.
The Role of DI in ADX Interpretation
The +DI and -DI lines play a crucial role in interpreting the ADX. When the +DI line crosses above the -DI line, it indicates a potential bullish trend, and vice versa. Traders often look for these crossovers as confirmation of a strong trend and as an entry signal.
Furthermore, observing the relative positions between the ADX line, +DI line, and -DI line can provide valuable insights into the overall strength and direction of the market.
Using the ADX in Trading Strategies
Trend Following with ADX
One popular way to use the ADX is in trend-following strategies. Traders can wait for the ADX to rise above a certain threshold, indicating a strong trend, and then enter trades in the direction of the trend. By aligning their trades with the prevailing trend, traders increase their chances of success.
However, it is important to remember that no indicator is foolproof, and risk management should always be a top priority.
Reversal Signals and ADX
The ADX can also be used to identify potential trend reversals. When the ADX begins to decline after reaching a high level, it suggests that the current trend may be losing momentum. Traders can use this as a signal to exit their positions or take a contrarian approach, looking for potential reversals.
Combining the ADX with other indicators, such as oscillators or candlestick patterns, can enhance the accuracy of reversal signals.
Limitations of the Average Directional Index
False Signals in ADX
Like any indicator, the ADX is not infallible and can generate false signals. During periods of low volatility or when the market is in a consolidation phase, the ADX may give misleading readings, leading to potential losses.
It is crucial to use the ADX in conjunction with other technical analysis tools to confirm signals and minimize false readings.
Dependence on Other Technical Indicators
While the ADX is a valuable indicator, it should not be used as the sole basis for trading decisions. It works best when combined with other technical indicators, such as oscillators, moving averages, or support and resistance levels.
By using multiple indicators, traders can increase the reliability of their analyses and make more informed trading decisions.
FAQs
What is the ADX?
The Average Directional Index (ADX) is a technical indicator that measures the strength of a trend, regardless of its direction. It helps traders identify potential entry and exit points in the market.
How is the ADX calculated?
The ADX is calculated based on the difference between the Positive Directional Indicator (+DI) and the Negative Directional Indicator (-DI). These indicators measure upward and downward price movements, respectively, and their difference is smoothed over a specified period to plot the ADX line.
How can the ADX be used in trading?
The ADX can be used in various trading strategies. Traders can use it to identify the strength of a trend, determine potential entry and exit points, and spot potential trend reversals. It is important to combine the ADX with other technical indicators and chart patterns for more accurate analyses.
Are there any limitations to using the ADX?
Yes, the ADX has limitations. It can generate false signals during periods of low volatility or when the market is consolidating. Additionally, the ADX should be used in conjunction with other technical indicators to confirm signals and minimize false readings.
What is the best way to use the ADX?
There is no one-size-fits-all answer to this question, as the best way to use the ADX depends on individual trading strategies and preferences. However, it is recommended to experiment with different timeframes and combine the ADX with other indicators to achieve the desired results.
As an experienced trader, I have found the ADX to be a valuable tool in my trading arsenal. Its ability to gauge the strength of a trend and identify potential reversals has helped me make more informed trading decisions. However, it is essential to remember that no indicator is foolproof, and risk management should always be a top priority.
If you are new to using the ADX, I recommend starting with a demo account and practicing different strategies to become familiar with its intricacies. As with any new tool, it takes time and practice to fully understand its potential and incorporate it effectively into your trading approach.
Ready to put the Average Directional Index (ADX) to the test in a real-world scenario? Look no further than Morpher, the innovative trading platform that's changing the game with blockchain technology. With Morpher, you can seamlessly apply your ADX strategies across a diverse range of markets, from stocks and cryptocurrencies to forex and even niche markets like NFTs. Experience the benefits of zero fees, infinite liquidity, and the freedom of fractional investing. Embrace the security of the Morpher Wallet, take advantage of up to 10x leverage, and dive into a unique trading experience with Virtual Futures. Sign Up and Get Your Free Sign Up Bonus today to elevate your trading to the next level with Morpher.

Disclaimer: All investments involve risk, and the past performance of a security, industry, sector, market, financial product, trading strategy, or individual’s trading does not guarantee future results or returns. Investors are fully responsible for any investment decisions they make. Such decisions should be based solely on an evaluation of their financial circumstances, investment objectives, risk tolerance, and liquidity needs. This post does not constitute investment advice.

Painless trading for everyone
Hundreds of markets all in one place - Apple, Bitcoin, Gold, Watches, NFTs, Sneakers and so much more.
Painless trading for everyone
Hundreds of markets all in one place - Apple, Bitcoin, Gold, Watches, NFTs, Sneakers and so much more.