In this ultimate guide, I will walk you through everything you need to know about using the Aroon Indicator in your trading strategy. Whether you're a beginner or an experienced trader, understanding and effectively utilizing this powerful tool can greatly enhance your success in the financial markets.
Understanding the Aroon Indicator
Origin and Purpose of the Aroon Indicator
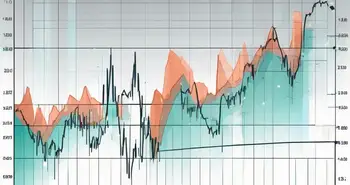
The Aroon Indicator, a valuable tool in technical analysis, was developed by Tushar Chande in 1995 with the primary goal of identifying the strength and direction of a trend within financial markets. Comprised of two key components – the Aroon Up and the Aroon Down lines – this indicator serves as a powerful means for traders to gauge the momentum of a market and anticipate potential reversals. The Aroon Up line measures the number of periods since the highest high, while the Aroon Down line tracks the number of periods since the lowest low. By comparing these two metrics, traders can make informed decisions based on the prevailing market conditions.
Understanding the Aroon Indicator's origin provides traders with a historical context that underscores the significance of this technical tool in modern trading practices. Tushar Chande's innovative approach to trend analysis has paved the way for a deeper understanding of market dynamics and trend identification, offering traders a strategic advantage in navigating the complexities of financial markets.
Basic Concepts and Terminology
Delving into the foundational principles of the Aroon Indicator, traders encounter essential concepts that form the basis of its calculations and interpretations. Notably, the indicator's scale ranges from 0 to 100, with a reading of 100 signaling a robust upward trend (Aroon Up) or downward trend (Aroon Down). Conversely, a reading of 50 indicates a market in equilibrium or a consolidation phase, highlighting the importance of balance in market dynamics.
Moreover, traders must grasp the contextual relevance of the Aroon Indicator, recognizing its optimal performance in trending markets. While the indicator excels in identifying and confirming trends, its efficacy may diminish in sideways or volatile market conditions. This nuanced understanding empowers traders to apply the Aroon Indicator judiciously, aligning its insights with the prevailing market environment for informed decision-making.
The Mathematics Behind the Aroon Indicator
Calculating the Aroon Up
The Aroon Up is calculated by finding the number of periods since the highest high and dividing it by the total number of periods.
Aroon Up = ((Number of periods) – (Number of periods since the highest high)) / (Number of periods) * 100
For example, if we're looking at a 14-period Aroon Indicator and the highest high occurred 5 periods ago, the Aroon Up would be ((14-5)/14) * 100 = 64.3%.
Calculating the Aroon Down
The Aroon Down is calculated in a similar manner to the Aroon Up, but it measures the number of periods since the lowest low.
Aroon Down = ((Number of periods) – (Number of periods since the lowest low)) / (Number of periods) * 100
Let's say the lowest low occurred 10 periods ago in our 14-period Aroon Indicator. The Aroon Down would be ((14-10)/14) * 100 = 71.4%.
Interpreting the Aroon Indicator
Identifying Trends with the Aroon Indicator
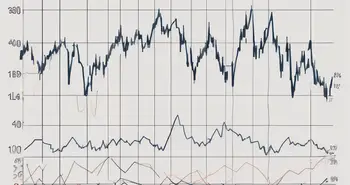
One of the primary uses of the Aroon Indicator is to identify the strength and direction of a trend. When the Aroon Up crosses above the Aroon Down, it signals a potential uptrend, while a crossover in the opposite direction suggests a potential downtrend. Traders often look for strong crossovers accompanied by high Aroon Indicator readings for reliable trend confirmation.
Recognizing Consolidation Periods
In addition to trend identification, the Aroon Indicator can also help traders recognize consolidation periods. When both the Aroon Up and Aroon Down lines hover around the 50 level, it indicates a lack of clear trend direction. During these periods, it may be best to wait for a breakout before taking positions.
Using the Aroon Indicator in Trading
Incorporating the Aroon Indicator in Your Trading Strategy
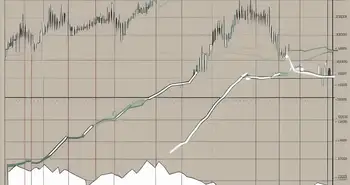
Now that you understand how the Aroon Indicator works and how to interpret its signals, let's discuss how to incorporate it into your trading strategy. One common approach is to use the indicator in combination with other technical analysis tools, such as moving averages or support and resistance levels. This can provide additional confirmation and increase the reliability of your trading signals.
For example, if the Aroon Up crosses above the Aroon Down and the price is trading above a significant moving average, it can be a strong buy signal. Likewise, if the Aroon Down crosses above the Aroon Up and the price breaks below a key support level, it may be a good time to sell or take a short position.
Personal advice / story:
Throughout my trading career, the Aroon Indicator has been an invaluable tool in identifying strong trends and potential reversals. I remember a particular trade where the Aroon Up crossed above the Aroon Down, indicating a bullish trend. Combined with other technical analysis signals, I entered a long position and captured a substantial profit as the price continued to climb. This experience solidified my trust in the Aroon Indicator and reaffirmed its effectiveness in my trading strategy.
Potential Pitfalls and Misinterpretations
While the Aroon Indicator is a powerful tool, it's essential to be aware of potential pitfalls and misinterpretations. First, it's crucial to use the indicator in conjunction with other analysis techniques to avoid relying solely on its signals. Additionally, the Aroon Indicator may generate false signals in choppy or sideways markets, so it's important to consider market conditions before making trading decisions.
Enhancing Your Strategy with the Aroon Oscillator
Understanding the Aroon Oscillator
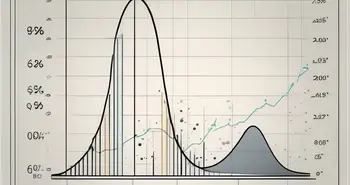
The Aroon Oscillator is derived from the Aroon Up and Aroon Down lines and provides a different perspective on the market's momentum. It calculates the difference between the Aroon Up and Aroon Down values, presenting it in a histogram format. Positive values indicate bullish momentum, while negative values suggest bearish momentum.
Using the Aroon Oscillator for Maximum Benefit
The Aroon Oscillator can be a valuable addition to your trading strategy, helping you identify potential trend reversals and divergences. For example, if the price is making higher highs while the Aroon Oscillator is making lower highs, it could signal a bearish divergence and warn of a potential trend reversal.
FAQs
What is the Aroon Indicator?
The Aroon Indicator is a technical analysis tool that measures the strength and direction of a trend. It consists of two lines – the Aroon Up and Aroon Down – and is used by traders to identify potential trend reversals and consolidation periods.
How is the Aroon Indicator calculated?
The Aroon Up and Aroon Down lines are calculated by finding the number of periods since the highest high and lowest low, respectively, and dividing it by the total number of periods. These values are then multiplied by 100 to get the Aroon Indicator readings.
How can I use the Aroon Indicator in my trading strategy?
To incorporate the Aroon Indicator into your trading strategy, it's recommended to use it in conjunction with other technical analysis tools. Look for strong crossovers and high Aroon Indicator readings to confirm trends, and consider using the Aroon Oscillator to identify potential trend reversals and divergences.
What are the potential pitfalls of the Aroon Indicator?
While the Aroon Indicator is a powerful tool, it's important to avoid relying solely on its signals. Use it in combination with other analysis techniques to increase reliability. Additionally, be cautious of false signals in choppy or sideways markets and consider market conditions when using the indicator.
Now armed with the knowledge of the Aroon Indicator, you can begin integrating this valuable tool into your trading strategy. Remember to always conduct thorough analysis and use additional confirmation signals to ensure the highest probability of success. Happy trading!
Ready to elevate your trading strategy with the Aroon Indicator and beyond? Discover the innovative world of Morpher, where you can apply your newfound knowledge on a platform designed for the future of investing. With zero fees, infinite liquidity, and the ability to trade across a multitude of asset classes, Morpher is the perfect partner for your trading journey. Embrace the power of fractional investing, short selling, and up to 10x leverage to maximize your potential in the markets. Sign up today at Morpher.com and receive your free sign-up bonus to kickstart your trading experience. Join Morpher and be part of a trading revolution!

Disclaimer: All investments involve risk, and the past performance of a security, industry, sector, market, financial product, trading strategy, or individual’s trading does not guarantee future results or returns. Investors are fully responsible for any investment decisions they make. Such decisions should be based solely on an evaluation of their financial circumstances, investment objectives, risk tolerance, and liquidity needs. This post does not constitute investment advice.

Painless trading for everyone
Hundreds of markets all in one place - Apple, Bitcoin, Gold, Watches, NFTs, Sneakers and so much more.
Painless trading for everyone
Hundreds of markets all in one place - Apple, Bitcoin, Gold, Watches, NFTs, Sneakers and so much more.