Stock Market Update: Is July Historically the Best Month for Stocks?
by Esin Syonmez
Share:


July is often considered a favorable month for stock market performance. This article examines the historical performance of stocks in July, compares it to other months, and explores the impact of economic indicators on the market. Additionally, strategies for investing in July and essential tips for success will be discussed.
Understanding Stock Market Seasonality
Before we dive into the specifics of July's stock market performance, it's crucial to understand the concept of stock market seasonality. Seasonality refers to the various recurring patterns and trends that can be observed in the stock market over certain periods. These patterns can be influenced by a variety of factors, including investor sentiment, economic indicators, and market cycles. By understanding stock market seasonality, investors can better anticipate potential opportunities and risks.
The Concept of Stock Market Seasonality
Stock market seasonality is based on the observation that certain months, seasons, or time periods tend to exhibit similar patterns in terms of stock market performance. For example, some months may historically have higher average returns, while others may be more volatile. Traders and investors use this information to develop strategies and adjust their portfolios accordingly.
Moreover, stock market seasonality is not limited to just monthly trends. It can also extend to different days of the week or even specific times of the day when certain patterns tend to emerge. This level of granularity in analyzing seasonality can provide traders with a more nuanced understanding of market behavior and potentially uncover hidden opportunities.
Factors Influencing Stock Market Seasonality
Several factors can influence stock market seasonality. These include market cycles, economic indicators, geopolitical events, and investor psychology. For instance, in the summer months, many investors may be on vacation or less active in the market, which can result in lower trading volumes and potentially more volatile markets.
It's important to note that while historical patterns can provide valuable insights, they are not foolproof indicators of future performance. Market conditions are constantly evolving, and unexpected events can disrupt even the most established seasonal trends. Therefore, investors should approach seasonality analysis with a blend of historical context and real-time market data to make well-informed decisions.
A Deep Dive into July's Stock Market Performance
Now that we have a solid understanding of stock market seasonality, let's take a closer July, often referred to as a pivotal month in the financial world, holds a special place in the hearts of investors. It is a time when the markets are abuzz with activity, as analysts and traders eagerly anticipate the unfolding of various market trends and performances.
Historical Performance of Stocks in July
Looking back at historical data, July has shown positive performance in the stock market. According to Dow Jones Market Data, since 1928, the S&P 500 has posted an average gain of 1.7% in July, finishing in positive territory 60% of the time. The Dow Jones Industrial Average's track record is even more impressive, having finished with a gain 65% of the time since 1897.
However, it's important to note that past performance does not guarantee future results. Delving deeper into the annals of stock market history, one can observe a recurring pattern of July being a month of resilience and growth. This trend has been attributed to various economic factors, including increased consumer spending during the summer months and a generally positive sentiment in the market.
Factors Contributing to July's Market Performance
Several factors can contribute to July's positive stock market performance. One possible reason is that companies often release their second-quarter earnings reports in July, which can have a significant impact on stock prices. Additionally, many investors tend to be more optimistic during the summer months, leading to increased buying activity and potentially driving up stock prices.
However, given the current market environment, numerous factors could pose a challenge to that historical track record this July. The market’s concentration in big tech stocks is a significant concern. The S&P 500's first-half gains were notably influenced by a handful of tech giants like Nvidia, whose performance heavily skews the overall index due to its large market capitalization.
July isn’t as impressive when it comes to the tech-heavy Nasdaq Composite. Since 1971, the Nasdaq has posted gains of less than 1% during July, making it the sixth best monthly performer of the year. This underscores the variability in performance across different indices and sectors.
Comparing July to Other Months in the Stock Market
While July may have historically shown positive stock market performance, it's essential to compare it to other months to gain a holistic view of the stock market throughout the year.
Understanding the seasonal trends in the stock market can provide valuable insights for investors looking to make informed decisions. The first half of the year, especially the months of January and February, often experience increased market volatility. This volatility can be attributed to year-end tax planning, profit-taking strategies, and corporate earnings releases. However, the months of April, May, and June have historically shown more stability and positive performance, offering a potential opportunity for investors to capitalize on market trends.
Stock Market Performance in the Second Half of the Year
July is the beginning of the second half of the year, and historically, it has been a positive month for stocks. However, it's worth noting that the stock market can experience increased volatility in August and September. These months tend to be more uncertain due to various factors, such as geopolitical events and potential policy changes.
As investors navigate through the second half of the year, they may also encounter the phenomenon known as the “September Effect.” This market anomaly suggests that stock prices tend to decline in September, possibly due to investors returning from summer vacations and reassessing their portfolios. Despite this potential downturn, October has historically shown resilience, with markets often rebounding from any September losses.
The Impact of Economic Indicators on July's Stock Market
Economic indicators play a crucial role in influencing stock market performance, and July is no exception. Let's explore some of the key economic indicators that can impact July's stock market.
The Role of Inflation and Interest Rates
Inflation and interest rates can have a significant impact on stock prices. In July, the Federal Reserve often releases its interest rate decision, which can influence market expectations and investor sentiment. Additionally, inflation data can provide insights into the overall health of the economy, potentially affecting stock market performance.
The Influence of GDP and Unemployment Rates
Gross Domestic Product (GDP) growth and unemployment rates are also important economic indicators to consider. Higher GDP growth and lower unemployment rates tend to have a positive impact on stock market performance. In July, investors closely monitor these indicators for any signs of economic strength or weakness.
Current Stock Market Concerns
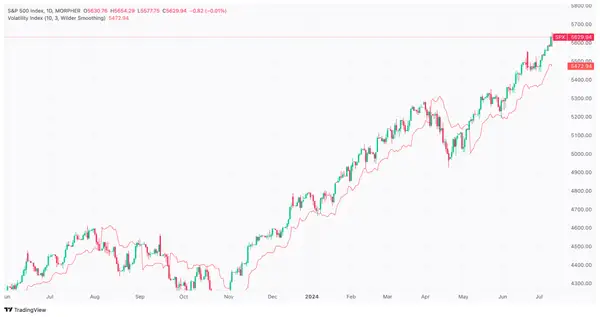
While historical data shows July as a strong month, current market dynamics add layers of complexity. The S&P 500 finished the first half of the year with an impressive 15% gain, and forecasts for the remainder of 2024 remain bullish. However, the concentration of gains in a few large-cap tech stocks like Nvidia, which significantly influences the index due to its large market cap, can skew overall market perceptions.
Moreover, the market is exhibiting signs of being overvalued. The Relative Strength Index (RSI), a momentum indicator, shows the S&P 500 with an RSI reading above 70, suggesting overbought conditions. This could precede a pullback as investors might sell shares to secure profits, putting July’s positive performance at risk.
Should Investors Be Concerned?
For buy-and-hold investors, month-to-month fluctuations should not be a primary concern. Short-term volatility is not indicative of long-term price action, and analysts generally agree that the second half of the year will see strong gains for the market. According to LSEG data, the S&P 500 is forecast to rise 10.4% during the remainder of 2024, which would result in a full-year gain of 25.4%, surpassing the average annual return of 10.5% since 1957.
Conclusion
While July has historically shown positive stock market performance, it is crucial to consider the broader market context and current economic indicators. By understanding stock market seasonality, monitoring economic indicators, and implementing effective investment strategies, investors can position themselves for potential success in July and beyond.
FAQ
Here are some frequently asked questions about July's historical stock market performance:
Is July consistently the best month for stocks?
While July has historically shown positive performance, it's important to note that there are no guarantees in the stock market. Past performance does not guarantee future results. It's crucial to consider a holistic view of the market and various factors that can influence stock prices.
What are some other months to consider for investing?
Other months that have historically shown positive stock market performance include April, May, and June. However, it's important to assess your investment goals, risk tolerance, and time horizon before making any decisions.
How can economic indicators impact stock market performance?
Economic indicators provide insights into the overall health of the economy and can impact investor sentiment. Key indicators to monitor include inflation rates, interest rates, GDP growth, and unemployment rates. These indicators can influence market expectations and potentially impact stock prices.
What are some general strategies for successful investing?
Successful investing involves careful analysis, diversification, and ongoing monitoring of market conditions. It's essential to develop a well-rounded investment strategy that aligns with your goals and risk tolerance. Working with a financial advisor can also provide valuable guidance and support.
In conclusion, while July has historically shown positive stock market performance, it's crucial to consider a holistic view of the market and various factors influencing stock prices. By understanding stock market seasonality, monitoring economic indicators, and implementing effective investment strategies, investors can position themselves for potential success in July and beyond.
Ready to take advantage of July's historical stock market trends and beyond with a cutting-edge platform? Discover Morpher.com, where innovative blockchain technology meets trading without boundaries. Experience zero fees, infinite liquidity, and the freedom to invest in a wide array of markets—from stocks to NFTs—with fractional investing and up to 10x leverage. Embrace the future of investing with the safety of a non-custodial Morpher Wallet. Sign Up and Get Your Free Sign Up Bonus today, and join the global community of traders who are reshaping the investment landscape with Morpher.

Disclaimer: All investments involve risk, and the past performance of a security, industry, sector, market, financial product, trading strategy, or individual’s trading does not guarantee future results or returns. Investors are fully responsible for any investment decisions they make. Such decisions should be based solely on an evaluation of their financial circumstances, investment objectives, risk tolerance, and liquidity needs. This post does not constitute investment advice.

Painless trading for everyone
Hundreds of markets all in one place - Apple, Bitcoin, Gold, Watches, NFTs, Sneakers and so much more.
Painless trading for everyone
Hundreds of markets all in one place - Apple, Bitcoin, Gold, Watches, NFTs, Sneakers and so much more.