
Throughout my years as a trading expert, I have come across various tools and indicators that can help traders gain an edge in the market. One such tool that has caught my attention is the Negative Volume Index. In this comprehensive guide, I will take you through the ins and outs of this indicator and show you how it can enhance your trading strategies.
Understanding the Basics of the Negative Volume Index
If you're new to trading or just starting to explore technical analysis, it's essential to understand the fundamentals of the Negative Volume Index (NVI). This indicator was developed by Paul Dysart and is based on the premise that when trading volume decreases on days when the price declines, it suggests that smart money is exiting the market.
Definition and Function of the Negative Volume Index
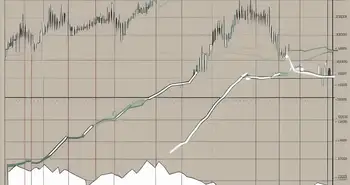
The Negative Volume Index (NVI) is a technical analysis indicator that uses volume data to reveal the strength or weakness of a particular market trend. It calculates the cumulative NVI value by summing the previous day's NVI with the percentage change in volume from the previous day. This cumulative value helps traders identify potential market reversals.
For example, if the NVI value is increasing over a period, it indicates that informed investors are entering the market despite the declining volume. Conversely, a decreasing NVI suggests that the smart money is leaving the market, even if the volume is increasing.
The Importance of the Negative Volume Index in Trading
Now, you might be wondering, why should I pay attention to the Negative Volume Index? Well, the NVI can provide valuable insights into market trends and help you make informed trading decisions. By analyzing the relationship between volume and price movements, the NVI can help you identify potential market reversals before they occur.
Imagine being able to anticipate a market reversal and enter a position while the majority of traders are still oblivious to the impending change. This is where the NVI truly shines. It acts as a powerful contrarian indicator and enables traders to stay ahead of the curve.
The Mechanics of the Negative Volume Index
Now that we have a solid understanding of the basics, let's delve deeper into how the Negative Volume Index is calculated and how you can interpret its values.
How the Negative Volume Index is Calculated
The Negative Volume Index calculation may sound complex, but once you grasp the concept, it becomes much simpler. The formula is as follows:
- Start with an initial value, often set at 1000.
- If the volume increases from the previous day, add the percentage change to the previous day's NVI value.
- If the volume decreases from the previous day, maintain the previous day's NVI value.
This cumulative calculation allows the indicator to reflect the cumulative effect of volume changes on market trends over time.
Interpreting the Negative Volume Index Values
When it comes to interpreting the Negative Volume Index values, there are a few key points to keep in mind. An increasing NVI indicates that informed investors are actively entering the market, even in the face of declining volume. This suggests a potential bullish trend.
On the other hand, a decreasing NVI suggests that smart money is leaving the market, regardless of an increase in volume. This indicates a potential bearish trend.
By monitoring these values, you can gain valuable insights into market sentiment and identify potential turning points in the market.
The Negative Volume Index and Market Trends
Now that you understand how the NVI works, let's explore how this indicator can be used to identify market reversals and its relationship with price movements.
Using the Negative Volume Index to Identify Market Reversals
One of the key benefits of the Negative Volume Index is its ability to identify potential market reversals ahead of time. As the NVI reflects the activities of informed investors, it can help traders anticipate shifts in market sentiment.
For example, if the NVI begins to rise while the price continues to decline, it suggests that smart money is accumulating positions, indicating a potential market upturn. Conversely, if the NVI starts to decline amid rising prices, it could signal that informed investors are gradually exiting the market, indicating a potential downtrend.
The Relationship Between the Negative Volume Index and Price Movements
It's important to note that the Negative Volume Index should not be used as a standalone indicator. For optimal results, it should be used in conjunction with other technical analysis tools to confirm signals.
When combined with other indicators such as moving averages or trendlines, the NVI can provide valuable confirmation of potential market reversals. This multi-faceted approach helps traders validate their trading decisions and improve the accuracy of their predictions.
Strategies for Using the Negative Volume Index
Now that you have a solid understanding of the Negative Volume Index and its significance in trading, let's explore some strategies to effectively incorporate it into your trading plan.
Combining the Negative Volume Index with Other Indicators
As mentioned earlier, using the Negative Volume Index in isolation may not provide you with the most accurate signals. To enhance its effectiveness, consider combining the NVI with other indicators such as moving averages, oscillators, or trendlines.
For example, if the NVI indicates a potential market reversal, you could confirm the signal by looking for additional signs, such as a bullish divergence on an oscillator or a breakout above a key resistance level.
Tips for Incorporating the Negative Volume Index into Your Trading Plan
Here are a few tips to help you effectively incorporate the Negative Volume Index into your trading plan:
- Understand the limitations: While the Negative Volume Index is a valuable tool, it is not foolproof. It is essential to consider its limitations and use it as part of a comprehensive trading strategy.
- Practice and backtest: Before using the NVI in live trading, take the time to practice and backtest your strategies. This will give you a better understanding of how the indicator performs in different market conditions.
- Stay disciplined: Like any trading tool, the Negative Volume Index requires discipline and patience. Stick to your trading plan and avoid making impulsive decisions based solely on NVI signals.
Common Misconceptions About the Negative Volume Index
Despite its effectiveness, the Negative Volume Index is not immune to misconceptions. Let's debunk some of the myths surrounding this indicator and understand its limitations.
Debunking Myths About the Negative Volume Index
One common misconception about the Negative Volume Index is that it can predict market movements with certainty. While the NVI can provide valuable insights into potential market reversals, it is important to remember that no indicator can guarantee future price movements.
Another misconception is that the NVI works equally well in all market conditions. The effectiveness of the Negative Volume Index can vary depending on the market's liquidity, volatility, and overall sentiment.
Understanding the Limitations of the Negative Volume Index
As with any technical analysis tool, the Negative Volume Index has its limitations. It is crucial to understand these limitations to make informed trading decisions.
One limitation is that the NVI relies solely on volume data, which may not accurately represent the intentions of all market participants. Additionally, the NVI may generate false signals during periods of low volume or during news events that affect market sentiment.
Therefore, it is important to use the NVI in conjunction with other indicators and consider the broader market context when analyzing its signals.
FAQ
Q: What is the Negative Volume Index?
The Negative Volume Index is a technical analysis indicator that uses volume data to reveal the strength or weakness of a particular market trend. It calculates the cumulative NVI value by summing the previous day's NVI with the percentage change in volume from the previous day.
Q: How does the Negative Volume Index help identify market reversals?
The Negative Volume Index helps identify potential market reversals by reflecting the activities of informed investors. When the NVI rises while the price declines, it suggests that smart money is accumulating positions, indicating a potential upturn. Conversely, a declining NVI amid rising prices could indicate a potential downtrend.
Q: Can the Negative Volume Index be used as a standalone indicator?
While the Negative Volume Index can provide valuable insights into market trends, it is recommended to use it in conjunction with other technical analysis tools to confirm signals. Combining the NVI with indicators like moving averages or trendlines can help validate trading decisions.
Q: What are the limitations of the Negative Volume Index?
The Negative Volume Index relies solely on volume data and may not represent the intentions of all market participants. Additionally, it may generate false signals during periods of low volume or news events that affect market sentiment. It is important to use the NVI alongside other indicators and consider the broader market context when analyzing signals.
By now, you should have a thorough understanding of the Negative Volume Index and its role in trading. Remember, successful trading requires a comprehensive approach and a deep understanding of various indicators. Use the NVI in conjunction with other tools, backtest your strategies, and stay disciplined. With practice and experience, you can leverage the Negative Volume Index to gain a competitive edge in the market.
Ready to apply the insights from the Negative Volume Index to your trading strategies? Embrace the future of investing with Mopher, the revolutionary trading platform that leverages blockchain technology to offer zero fees, infinite liquidity, and a unique trading experience. Whether you're interested in stocks, cryptocurrencies, or even unconventional markets, Morpher's fractional investing, short selling capabilities, and up to 10x leverage can help you maximize your trading potential. Sign up now to take control of your investments with the Morpher Wallet and get your free sign-up bonus. Sign Up and Get Your Free Sign Up Bonus.

Disclaimer: All investments involve risk, and the past performance of a security, industry, sector, market, financial product, trading strategy, or individual’s trading does not guarantee future results or returns. Investors are fully responsible for any investment decisions they make. Such decisions should be based solely on an evaluation of their financial circumstances, investment objectives, risk tolerance, and liquidity needs. This post does not constitute investment advice.

Painless trading for everyone
Hundreds of markets all in one place - Apple, Bitcoin, Gold, Watches, NFTs, Sneakers and so much more.
Painless trading for everyone
Hundreds of markets all in one place - Apple, Bitcoin, Gold, Watches, NFTs, Sneakers and so much more.