
Market breadth indicators are essential tools for investors and traders looking to gain insight into the overall health and direction of the market. In this comprehensive guide, we will delve into the various aspects of market breadth indicators, from understanding their definition and importance to interpreting their signals and predicting market trends. By the end of this article, you will have a strong foundation to confidently incorporate market breadth indicators into your investment strategy.
Understanding Market Breadth Indicators
Before we dive into the specifics, it's crucial to grasp the concept of market breadth indicators and why they matter. Market breadth indicators measure the level of participation in a market move by examining the number of advancing and declining stocks or other market components.
One important reason to pay attention to market breadth indicators is their ability to provide a more comprehensive view of the market compared to just focusing on individual stocks or indices. They offer a broader perspective by considering the overall strength or weakness of the market through the collective performance of its components.
Definition and Importance of Market Breadth Indicators
In simple terms, market breadth indicators track the breadth or width of market participation. They reveal the number of stocks or other assets that are advancing versus those that are declining at any given time.
Market breadth indicators are vital for several reasons. Firstly, they can help identify the underlying strength or weakness of a market. When a market is strong, there is generally broad participation across various sectors and industries. Conversely, weak market conditions often result from limited participation and narrow movement in a few select stocks.
Additionally, market breadth indicators can provide early warnings of potential market turning points. By assessing the overall participation in a market move, investors can gauge shifts in sentiment and anticipate reversals or continuations of trends.
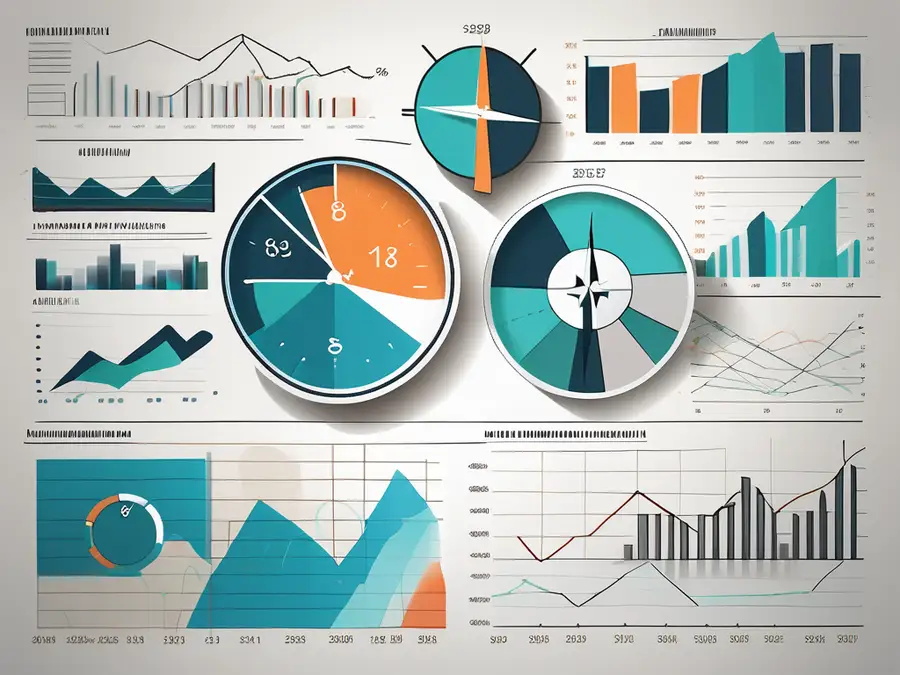
Different Types of Market Breadth Indicators
There are various types of market breadth indicators, each providing unique insights into the market's internal dynamics. Some commonly used market breadth indicators include:
- Advance-Decline Line: This indicator compares the number of advancing stocks to the number of declining stocks over a specific period. It offers an overview of market strength or weakness.
- Up Volume-Down Volume: This indicator measures the volume of shares traded in advancing stocks versus declining stocks. It reveals the intensity of buying or selling pressure in the market.
- McClellan Oscillator: This oscillator combines the advances and declines in the market to provide a smoothed reading that helps identify overbought and oversold conditions.
- New Highs-New Lows: This indicator tracks the number of stocks making new highs versus new lows. It helps assess market sentiment and potential trend reversals.
Each market breadth indicator has its strengths and weaknesses, and combining multiple indicators can offer a more comprehensive analysis of market breadth.
The Role of Market Breadth Indicators in Investment Strategy
Now that we have a solid understanding of market breadth indicators, let's explore their role in investment strategy and how they can influence decision-making.
How Market Breadth Indicators Influence Investment Decisions
Market breadth indicators provide valuable insights that can help guide investment decisions. By assessing the overall participation and strength of a market move, investors can gauge whether a particular trend is sustainable or nearing exhaustion.
For example, if a market is experiencing a strong uptrend with broad participation across various sectors, it suggests a healthy market environment. This information can support a bullish investment stance, leading investors to allocate more capital to potential opportunities.
On the other hand, if market breadth indicators show a decline in participation and a narrowing of market movement, it may signal a weakening market. This information could prompt investors to exercise caution and potentially reduce exposure to higher-risk assets.
The Impact of Market Breadth on Portfolio Diversification
Market breadth indicators play a crucial role in portfolio diversification. A well-diversified portfolio consists of assets spread across different sectors, industries, and asset classes. By monitoring market breadth, investors can assess the level of diversification and identify potential risks.
When market breadth is strong, indicating broad participation, it suggests that various sectors and industries are performing well. This situation provides a favorable climate for diversification, as it increases the likelihood of finding investment opportunities with non-correlated returns. Conversely, if market breadth weakens, it might be an indication of a narrower market, which could limit diversification options.
Interpreting Market Breadth Indicators
While understanding the definition and importance of market breadth indicators is crucial, knowing how to interpret them is equally essential. Let's explore some key elements of interpreting market breadth indicators.
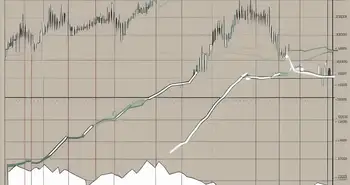
Reading and Analyzing Market Breadth Charts
Market breadth charts typically display the indicator's values against a time series. When analyzing these charts, it's important to look for patterns, trends, and divergences that could provide insights into market sentiment and potential reversals.
For example, if the market is making new highs, but the market breadth indicator fails to confirm this with new highs as well, it may be a sign of a weakening market. This type of divergence can be a valuable warning signal to reassess investment strategies and adjust positions accordingly.
Common Misinterpretations of Market Breadth Indicators
Market breadth indicators are powerful tools, but they require caution in interpretation to avoid common pitfalls. One common misinterpretation is relying solely on one indicator and disregarding potential corroborating signals from other indicators.
Another mistake is failing to account for market context. Market breadth indicators should be considered in the broader market environment, including factors such as economic conditions, interest rates, and geopolitical events. Ignoring these contextual factors can lead to skewed interpretations and potentially wrong investment decisions.
Market Breadth Indicators and Market Trends
Market breadth indicators have a crucial role in predicting and understanding market trends. Let's explore their relationship and how market breadth indicators can help forecast market movements.
How Market Breadth Indicators Predict Market Movements
Market breadth indicators provide insights into the overall strength or weakness of a market. They can help identify the underlying market sentiment and potential shifts in investor behavior.
For example, when a market is on an uptrend, strong market breadth indicators indicate a broad participation in the rally, suggesting that the trend is robust and likely to continue. Conversely, if market breadth starts to deteriorate, it might signal diminishing participation and a potential change in market direction.
By monitoring market breadth indicators alongside other technical and fundamental factors, investors can gain a more comprehensive understanding of market trends and make informed investment decisions.
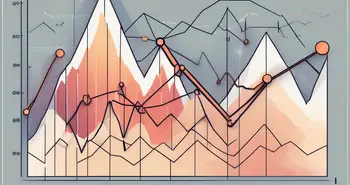
The Relationship Between Market Breadth and Market Volatility
Market breadth and market volatility are closely related. Market breadth indicators can help assess the level of market participation and sentiment, which has implications for market volatility.
During periods of heightened market breadth, where a significant number of market components are participating, market volatility tends to be lower. This is because broad participation generates stability and reduces the impact of individual stock movements on the overall market.
Conversely, when market breadth weakens, market volatility tends to increase. This is due to the reduced participation and increased vulnerability of the market to individual stock movements, potentially leading to more significant price swings.
Understanding the relationship between market breadth and market volatility can help investors gauge risk levels and adjust their investment strategies accordingly.
Advanced Concepts in Market Breadth Indicators
Now that you are well-versed in the basics of market breadth indicators let's explore some advanced concepts to further enhance your understanding.
The Role of Market Breadth Indicators in Technical Analysis
Market breadth indicators are powerful tools in technical analysis. They help validate or challenge the signals generated by other technical indicators and provide a broader context for interpreting price movements.
For example, if a technical indicator, such as the Relative Strength Index (RSI), suggests an overbought condition in a particular stock, analyzing the market breadth can provide additional insight. If the market breadth indicators confirm a robust participation in the uptrend, it strengthens the case for sustained upward momentum and potentially reduces the risk of a false signal.
Market Breadth Indicators and Algorithmic Trading
Market breadth indicators are also widely used in algorithmic trading strategies. Algorithms utilize market breadth indicators to determine market conditions, execute trades, and manage risk.
Algorithmic trading systems incorporate market breadth indicators to identify trending markets, breakout patterns, and potential reversals. By using these indicators in conjunction with other technical factors, algorithms can make rapid and data-driven decisions without human intervention.
Personal Experience: As an experienced investor, I have witnessed firsthand the power of market breadth indicators in shaping investment decisions. One notable instance was during a period of market volatility, where many individual stocks were experiencing significant price fluctuations. By analyzing market breadth indicators, I was able to identify the weakening participation and underlying weakness in the market, prompting me to adjust my portfolio allocations and protect against potential downturns.
FAQ
What are market breadth indicators?
Market breadth indicators track the level of participation in a market move by examining the number of advancing and declining stocks or other market components. They provide a broader perspective on market health and direction compared to focusing only on individual stocks or indices.
Why are market breadth indicators important?
Market breadth indicators are important because they offer insights into the overall strength or weakness of a market and provide early warnings of potential market turning points. They help investors gauge shifts in sentiment and anticipate reversals or continuations of trends.
What are some common market breadth indicators?
Some common market breadth indicators include the advance-decline line, up volume-down volume, the McClellan Oscillator, and new highs-new lows. Each indicator provides unique insights into market breadth and can be used to assess market strength or weakness.
How do I interpret market breadth indicators?
When interpreting market breadth indicators, it's important to look for patterns, trends, and divergences that could provide insights into market sentiment and potential reversals. Additionally, it's crucial to consider the broader market context and not rely solely on one indicator.
How do market breadth indicators predict market movements?
Market breadth indicators predict market movements by providing insights into the overall strength or weakness of a market. They help identify the underlying market sentiment and potential shifts in investor behavior. For example, strong market breadth indicators during an uptrend suggest broad participation and a higher likelihood of the trend continuing.
In conclusion, market breadth indicators are powerful tools for investors and traders. They offer a broader perspective on market health and direction, help predict market movements, and aid in investment strategy and portfolio diversification. By understanding the concepts and interpreting market breadth indicators effectively, investors can make informed decisions and navigate the dynamic world of the financial markets with confidence.
Ready to put your knowledge of market breadth indicators to the test? Join Morpher, the revolutionary trading platform that's changing the game with blockchain technology. With Morpher, you can trade a vast array of assets—from stocks and cryptocurrencies to unique markets like NFTs and sneakers—without any fees and with infinite liquidity. Start with as little as $1 through fractional investing, take advantage of short selling without interest fees, and enjoy up to 10x leverage to boost your trading power. Experience the safety of the non-custodial Morpher Wallet and explore a unique trading experience with Virtual Futures. Sign Up and Get Your Free Sign Up Bonus today to elevate your investment strategy on a global platform designed for traders like you.

Disclaimer: All investments involve risk, and the past performance of a security, industry, sector, market, financial product, trading strategy, or individual’s trading does not guarantee future results or returns. Investors are fully responsible for any investment decisions they make. Such decisions should be based solely on an evaluation of their financial circumstances, investment objectives, risk tolerance, and liquidity needs. This post does not constitute investment advice.

Painless trading for everyone
Hundreds of markets all in one place - Apple, Bitcoin, Gold, Watches, NFTs, Sneakers and so much more.
Painless trading for everyone
Hundreds of markets all in one place - Apple, Bitcoin, Gold, Watches, NFTs, Sneakers and so much more.