Reading a company's earnings report might sound intimidating, but it doesn't have to be! These reports are packed with important information that can help you understand how well a business is doing and guide your investment decisions. Think of an earnings report as a report card for the company, showing its financial health and future potential. The more you know how to read these report cards, the better you can make smart moves in the stock market.
Right now, we're in the October 2024 earnings season, where companies across different sectors are revealing their performance over the past few months. This is a big deal for investors because these reports tell the story of how businesses are handling challenges like rising costs and changing demand.
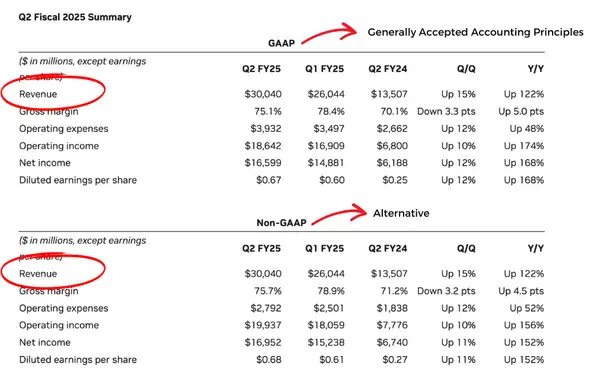
A standout from this season is Nvidia, which in August reported its Q2 fiscal year 2025 earnings. The company delivered record-breaking results, with total revenue surging 122% year-over-year to $30.0 billion, well above its outlook of $28.0 billion. Nvidia also announced an additional $50 billion to its share repurchase authorization, highlighting its confidence in continued growth.
Meanwhile, Tesla is preparing to release its third-quarter earnings report on October 23, 2024. Investors are eagerly waiting to see how Tesla's new developments, including its highly anticipated robotaxi model, will impact its financial performance and market valuation. This report could be a turning point for Tesla, highlighting the importance of staying updated with these earnings announcements.
That’s why understanding these examples is more than just interesting—it’s essential. Learning to read an earnings report is like unlocking a backstage pass to the company's performance, giving you insights that can guide your investment strategy. In this guide, we’re here to make sure you get all the tools you need to read these reports with confidence. We’ll break down every section, explain what each number means, and show you how to turn those insights into real financial decisions.
What is an Earnings Report?
When a company releases an earnings report, it is essentially opening its financial books to the public, allowing investors, analysts, and other stakeholders to gain insight into its financial health and performance. This transparency is crucial for maintaining trust and credibility in the market.
An earnings report, also known as a quarterly or annual report, is a comprehensive document that discloses a company's financial results over a specific period. It provides detailed information on a company's revenue, expenses, profits, and other key financial metrics.
Within an earnings report, you can find a breakdown of revenue sources, operating costs, earnings per share (EPS), and often a management discussion and analysis (MD&A) section. These details offer a comprehensive view of how the company is performing and where it may be headed in the future.
Earnings Report Key Figures
Earnings reports consist of various sections that shed light on different aspects of a company's financial performance. Let's explore the key components you need to pay attention to:
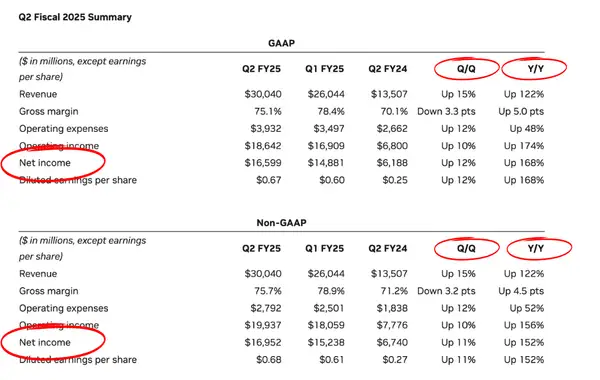
1. Revenue (Top Line) Definition: Revenue is the total amount of money a company earns from its business activities during a specific period. It's often referred to as the “top line” because it is the first item listed on an income statement. Significance: Revenue is a crucial metric to gauge the company's growth. Investors often look at year-over-year (YoY) and quarter-over-quarter (QoQ) revenue changes to assess whether the company is expanding or shrinking. Consistent growth in revenue indicates increasing demand for the company's products or services. Example: For instance, if a company’s revenue increases steadily every quarter, but net income remains flat, it might signal that costs are rising faster than sales. This could mean that the company is either investing heavily in growth or struggling to control expenses.
2. Net Income (Bottom Line) Definition: Net income, also known as net profit, is the amount left after subtracting all expenses, taxes, and costs from a company's revenue. It's referred to as the “bottom line” because it's the final figure on the income statement. Importance: Net income is a direct measure of a company’s profitability. Positive net income indicates that the company is profitable, while a negative figure (net loss) means it is spending more than it earns. Usage: Investors often compare net income between companies in the same sector to determine which one manages its expenses more efficiently. For example, a company with a stable or increasing net income while maintaining its revenue could be a strong performer in controlling costs.
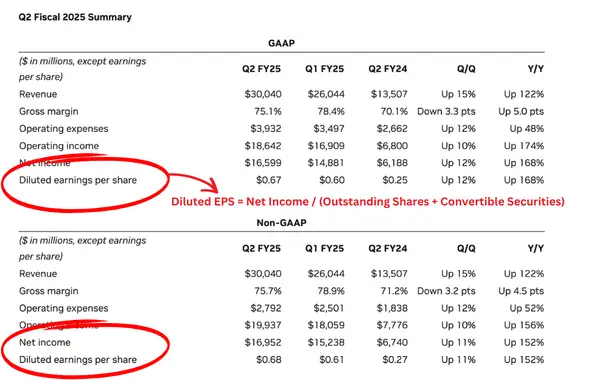
3. Earnings Per Share (EPS)
Definition: EPS represents the portion of a company’s profit allocated to each outstanding share of its common stock. It’s calculated by dividing the net income by the total number of outstanding shares. Interpretation: A higher EPS usually indicates that a company is more profitable and generates more earnings per share of its stock. Investors often use EPS to compare profitability among different companies within the same industry. Example: If a company's EPS increases significantly from one quarter to the next, it often leads to a rise in the stock price because it shows the company is generating more profit per share.
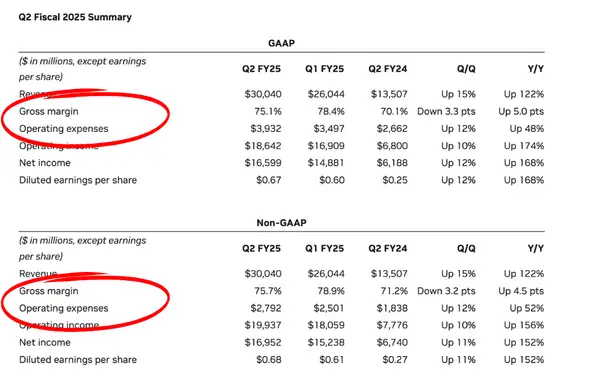
4. Operating Expenses
Explanation: Operating expenses include all costs necessary to run the company's core operations, such as salaries, rent, utilities, and marketing expenses. These are regular expenses that are crucial for the day-to-day running of the business. Analysis: Monitoring operating expenses helps investors see how efficiently a company is running. If these expenses are growing faster than revenue, it might indicate the company is struggling to manage its costs. Practical Tip: Be on the lookout for red flags, like operating expenses increasing at a higher rate than revenue growth. This could mean that the company’s profitability is being squeezed.
5. Cash Flow Statement Definition: The cash flow statement is divided into three main components: Operating Activities: Cash generated or used in the company’s core business operations. Investing Activities: Cash spent on or received from investments in assets like property, equipment, or other companies. Financing Activities: Cash flows related to borrowing, repaying debt, or issuing equity. Importance: Positive cash flow, especially from operating activities, is a sign that the company is generating enough money to sustain its operations and potentially fund future growth without relying on external financing. Example: If a company reports a net loss but has a positive cash flow from operations, it may still be in good financial health, indicating that its core business is generating sufficient cash.
6. Balance Sheet Components: The balance sheet provides a snapshot of a company's financial position at a specific point in time. It consists of three key components: Assets: What the company owns (cash, inventory, property). Liabilities: What the company owes (debt, accounts payable). Shareholders' Equity: The net value or worth of the company (Assets – Liabilities). Interpretation: By comparing the assets and liabilities, investors can assess the company's financial stability and risk level. A high level of liabilities compared to assets might indicate financial stress or heavy reliance on borrowing. Tip: Beginners should focus on a company's debt levels—high debt relative to equity might signal that the company is taking on more risk.
Analyzing Trends and Patterns in Earnings Reports
When analyzing an earnings report, it's crucial to look beyond the individual numbers and focus on the bigger picture. One effective way to do this is by comparing the company's current performance with its past results through Year-over-Year (YoY) and Quarter-over-Quarter (QoQ) comparisons. This approach helps reveal growth trends or potential warning signs. For example, if you notice that a company’s revenue and net income have been steadily rising year after year but suddenly show a decline, this shift might indicate challenges in the business or broader market conditions.
A careful eye on certain red flags can also make a big difference when interpreting financial data. For instance, if operating expenses are growing faster than revenue, it could suggest inefficiencies in managing costs or unexpected increases in spending that might hurt profitability. Similarly, a decreasing gross margin over multiple quarters could mean that the company's production costs are rising, making it harder to maintain healthy profit margins.
Digging deeper into the sources of a company’s revenue can provide valuable insights into its growth strategy. It’s essential to understand whether the boost in revenue comes from the core products, new product launches, or one-time events like a large contract or acquisition. Sustainable growth tends to come from recurring sources rather than from occasional spikes. Take Nvidia's recent surge in its Data Center segment, for example—driven by the rising demand for AI computing, which seems like a trend that's here to stay, rather than a short-term boost.
Another critical aspect of an earnings report is the company's guidance and forward-looking statements. During earnings calls, management often provides forecasts about the company's future performance. These predictions can play a significant role in shaping investor sentiment. If a company projects strong growth in the upcoming quarters, it can lead to a surge in investor confidence. Conversely, a cautious outlook might raise concerns about potential challenges ahead.
Finally, using the information in an earnings report to make investment decisions requires considering how the company stacks up against its competitors. Comparing its performance to industry peers can reveal whether it’s outperforming or lagging behind the market. Also, don’t overlook the impact of macroeconomic factors like changes in interest rates or broader market trends, as these can greatly influence the company's performance. For instance, even if a company’s revenue remains flat while the entire industry is facing a downturn, maintaining steady numbers could actually be a sign of strength and resilience.
This approach to analyzing trends and patterns in earnings reports will help you move beyond the basics and give you a clearer perspective on the company's overall financial health. It’s all about seeing the story that the numbers tell and using those insights to make more informed decisions.
Beyond the Numbers: Qualitative Aspects of Earnings Reports
In addition to the financial figures, earnings reports often include qualitative information that offers valuable insights into a company's operations and future prospects.
Management Discussion and Analysis
Management discussion and analysis (MD&A) provides a narrative explanation of a company's financial results, insights into its strategic initiatives, and risks it faces. Pay close attention to the management's assessment of the company's performance and prospects.
Within the MD&A section, key details such as the company's competitive positioning, market trends, and future outlook are often discussed. Understanding the strategic direction outlined by management can offer valuable context to the financial numbers presented in the report.
Notes to Financial Statements
Notes to financial statements provide additional details and explanations related to the financial figures presented in the report. They may include information on accounting policies, contingent liabilities, and significant events impacting the company's financial position. Reviewing these notes can provide a deeper understanding of the numbers presented.
Furthermore, the notes to financial statements can shed light on any potential risks or uncertainties that may not be immediately apparent from the balance sheet or income statement. By carefully examining these disclosures, investors can better assess the overall financial health and stability of the company.
Potential Red Flags in Earnings Reports
While earnings reports are vital in assessing a company's financial health, it is essential to be aware of potential red flags that may indicate underlying issues.
Inconsistent Revenue and Earnings Growth
A company with erratic revenue and earnings growth may face challenges in sustaining profitability. Look for consistency in revenue and earnings growth over time, as significant fluctuations may indicate underlying issues such as market saturation, changing consumer preferences, or poor management.
High Debt Levels
Excessive debt can burden a company's financial position and impact its ability to invest in growth opportunities. Assess a company's debt levels in relation to its earnings and cash flow to ensure its debt obligations are manageable.
Personal Advice: When analyzing earnings reports, it's essential to consider the broader economic and industry trends. A deep understanding of the company's business model, competitive landscape, and management's track record will help you make more informed investment decisions.
Steps for Using Earnings Reports in Investment Decisions
Start by Checking the Headline Numbers
What to do: Open the earnings report and go straight to the top-line figures like revenue and net income. Make a note of whether these numbers have increased or decreased compared to the same period last year (YoY) and the previous quarter (QoQ). Why it matters: Rising revenue and net income are usually positive indicators of growth, while declining numbers could be a red flag.
Calculate the Price-to-Earnings (P/E) Ratio
Action: Use the formula: Current Stock Price ÷ Earnings Per Share (EPS). This calculation can often be found on financial websites or by using a stock screener tool. Decision Tip: If the P/E ratio is much higher than its peers, investigate why. It could mean the stock is overvalued or that investors expect big growth.
Analyze the Operating Expenses
Action: Look at the trend in operating expenses over the last few quarters. Are they growing faster than revenue? This information is usually listed under “Operating Expenses” or “SG&A (Selling, General, and Administrative)”. Decision Tip: If expenses are rising without a corresponding increase in revenue, consider whether the company might be struggling with efficiency.
Review Management’s Forward Guidance
Action: Listen to the company's earnings call or read the transcript. Focus on what the management says about future revenue expectations, new projects, or potential risks. Decision Tip: If the guidance is positive and exceeds market expectations, it’s a good sign to consider buying or holding the stock. If the guidance is cautious, think carefully before making a move.
Compare the Company to Its Competitors
Action: Use a financial comparison tool or website to see how this company’s key metrics (revenue growth, net income, P/E ratio) stack up against its competitors. Decision Tip: If your company is outperforming its peers consistently, that’s a strong sign. If it’s lagging behind, dig deeper to understand why.
Check for Market and Economic Influences
Action: Look at broader market trends and economic factors like interest rates, inflation, or industry-wide changes that might impact the company's performance. Decision Tip: If market conditions are tough but the company is still doing well, it might be a solid investment despite the macroeconomic pressures.
Make Your Investment Decision
Action: Based on all the data you've gathered, decide if you should buy, hold, or sell the stock. Remember to consider your own risk tolerance and investment goals. Pro Tip: Never make your decision based on one single earnings report alone. Use a combination of these insights for a more balanced view.
Frequently Asked Questions
What is the purpose of an earnings report?
Earnings reports provide comprehensive information about a company's financial performance during a specific period. They help investors assess a company's profitability, growth potential, and overall financial health.
What are the key components of an earnings report?
An earnings report typically includes sections on revenue and sales figures, operating expenses, net income, earnings per share, and additional qualitative information such as management discussion and analysis and notes to financial statements.
What should I look for when interpreting earnings reports?
When interpreting earnings reports, pay attention to profit margins, revenue growth, and the sustainability of earnings. Also, consider qualitative aspects such as management's assessment of the company's performance and any potential red flags.
What are some potential red flags in earnings reports?
Potential red flags in earnings reports include inconsistent revenue and earnings growth and high debt levels. These may indicate underlying issues impacting a company's financial health and long-term prospects.
Putting It All Together
Once you’ve gone through these practical steps, take a moment to look at the bigger picture. Are there consistent trends that indicate long-term growth, or do you see red flags that need more investigation? This comprehensive approach will help you make more confident and informed investment decisions.
Morpher offers a unique trading experience that allows you to trade stocks without the traditional barriers of high fees, restricted market hours, or liquidity concerns. With Morpher, you can access thousands of stocks, use fractional trading to invest in any amount, and even leverage your trades up to 10x to maximize your potential gains.
Start trading on Morpher today and take control of your investments with a platform designed to empower every trader, from beginner to expert.
Disclaimer: All investments involve risk, and the past performance of a security, industry, sector, market, financial product, trading strategy, or individual’s trading does not guarantee future results or returns. Investors are fully responsible for any investment decisions they make. Such decisions should be based solely on an evaluation of their financial circumstances, investment objectives, risk tolerance, and liquidity needs. This post does not constitute investment advice.
Painless trading for everyone
Hundreds of markets all in one place - Apple, Bitcoin, Gold, Watches, NFTs, Sneakers and so much more.
Painless trading for everyone
Hundreds of markets all in one place - Apple, Bitcoin, Gold, Watches, NFTs, Sneakers and so much more.
Subscribe now to our newsletter to get critical insights and analysis: