
As a seasoned trader, understanding the different types of moving average indicators is essential. In this article, we will explore the key differences between Exponential Moving Average (EMA) and Simple Moving Average (SMA). By the end, you'll have a clearer picture of which indicator is better suited for your trading strategy.
Understanding Moving Average Indicators
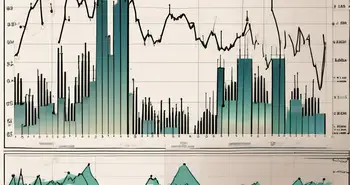
Moving averages are widely used in technical analysis to identify trends, gauge market sentiment, and generate potential buying or selling signals. They do this by calculating the average price of a financial instrument over a specified time period.
Traders often use moving averages to smooth out price data and help confirm trends. By plotting different moving averages on a chart, traders can visually see how the price is moving relative to these averages, which can provide valuable insights into the strength and direction of a trend.
Defining EMA (Exponential Moving Average)
The Exponential Moving Average (EMA) places a heavier weight on recent prices, making it more responsive to price changes. This makes it particularly useful for short-term traders looking to capitalize on quick market movements.
EMA reacts more quickly to price changes compared to SMA, which can be both an advantage and a disadvantage. While it can provide timely signals for entering or exiting trades, it can also be more prone to false signals during periods of high volatility.
Defining SMA (Simple Moving Average)
In contrast, the Simple Moving Average (SMA) gives equal weight to all prices within the chosen time period. It is commonly used by long-term traders to identify longer-term trends and filter out short-term noise.
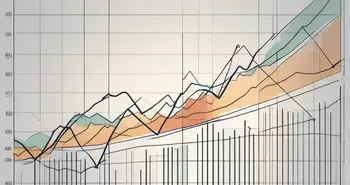
Many traders use the crossover of different moving averages, such as the 50-day SMA crossing above the 200-day SMA, as a signal of a potential change in trend direction. This strategy, known as the “golden cross” when the shorter-term average crosses above the longer-term average, or the “death cross” when the opposite occurs, is a popular technique among trend-following traders.
Key Differences Between EMA and SMA
Now let's delve deeper into the differences between EMA and SMA.
When it comes to technical analysis in the world of trading, understanding the nuances between Exponential Moving Average (EMA) and Simple Moving Average (SMA) can make a significant impact on your decision-making process. While both are popular tools used to analyze price trends and identify potential entry and exit points, their calculation methods and sensitivity to price changes set them apart.
Calculation Method
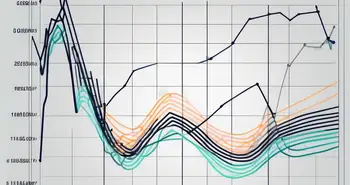
The calculation of the EMA incorporates a smoothing factor that places greater emphasis on recent prices. This means that the EMA reacts more quickly to price changes compared to the SMA, making it more suitable for traders who want to capture short-term trends. On the other hand, SMA calculations simply average out the prices over the selected time period, resulting in a smoother line that is better suited for identifying long-term trends.
Traders often use the EMA for its responsiveness to recent price movements, allowing them to adapt quickly to changing market conditions. The exponential weighting in EMA calculations assigns more significance to the most recent data points, reflecting the evolving nature of stock prices in real-time. In contrast, the SMA provides a more stable and lagging indicator, which can be beneficial for traders looking for confirmation of longer-term trends.
Sensitivity to Price Changes
Due to its calculation method, the EMA is more sensitive to price changes compared to the SMA. This can be both an advantage and a disadvantage, depending on your trading style. If you prefer to make quick trades based on short-term price fluctuations, EMA may be the better choice. However, if you're looking to stay invested in a position for a longer period, the SMA's slower response to price changes may be more appropriate.
It's important to note that the heightened sensitivity of EMA to recent price movements can sometimes lead to increased volatility in signals, potentially resulting in more frequent false signals compared to the smoother SMA. Traders often experiment with different moving average types and time periods to find the optimal balance between responsiveness and reliability based on their trading strategies and risk tolerance.
Time Period Considerations
The choice of time period for calculating the moving average is crucial. Shorter time periods lead to faster-moving averages, which are more suited for active traders. Conversely, longer time periods result in slower-moving averages that are favored by swing traders or investors with a longer-term outlook.
Traders often adjust the time period of their moving averages based on the volatility of the underlying asset and their trading objectives. Short-term traders may opt for shorter time periods to capture quick price movements, while long-term investors may prefer longer time periods to filter out short-term noise and focus on broader market trends. Understanding the impact of time period selection on the interpretation of moving averages is essential for effectively incorporating these technical indicators into your trading toolkit.
Advantages and Disadvantages of EMA
Let's now examine the advantages and disadvantages of using the EMA as a moving average indicator.
Pros of Using EMA
- The EMA reacts quickly to price changes, making it ideal for short-term traders.
- It captures recent market developments effectively, enabling traders to enter and exit positions promptly.
- EMA can provide valuable signals during volatile market conditions, where price movements occur rapidly.
Cons of Using EMA
- The EMA's responsiveness to price changes can also lead to false signals, especially during periods of market consolidation or when prices experience excessive volatility.
- It may generate more frequent and shorter-lived trading signals compared to the SMA, requiring traders to be more active and vigilant.
- EMA's sensitivity to recent prices means it can be easily affected by temporary price spikes, potentially leading to whipsaw trades.
Advantages and Disadvantages of SMA
Now it's time to evaluate the advantages and disadvantages of using the SMA as a moving average indicator.
Pros of Using SMA
- The SMA is better suited for identifying long-term trends and filtering out short-term noise.
- It provides a smoother line, which can help traders visualize the overall market direction more easily.
- SMA signals are generally more reliable for longer-term investors, who are less concerned with short-term fluctuations.
Cons of Using SMA
- The SMA's slower response to price changes means it may lag behind rapidly moving markets, potentially resulting in missed trading opportunities.
- It may not be as effective during volatile or choppy market conditions, as the SMA's signal may be delayed due to its overall smoothing effect.
- SMA's reliance on older prices can make it less sensitive to recent market developments, which could be of interest to short-term traders.
Choosing the Right Indicator for Your Trading Strategy
Ultimately, the choice between EMA and SMA comes down to your trading strategy and preferred time horizon.
When to Use EMA
If you are an active trader, looking for short-term opportunities and able to closely monitor price movements, EMA can be an excellent choice. Its responsiveness to recent prices makes it valuable in fast-moving markets and when aiming to catch short-term trends.
When to Use SMA
On the other hand, if you have a longer-term outlook and want to focus on the bigger picture, SMA is likely to suit your trading style more. Its smoother line provides a clearer view of the overall trend, filtering out short-term noise that may distract longer-term investors.
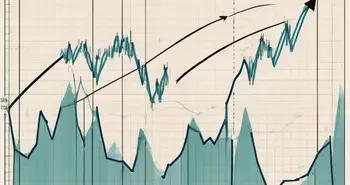
Personal Advice: I have found that combining both EMA and SMA can be advantageous in certain situations. For example, when the EMA and SMA lines cross over each other, it often signals a potential change in trend. This can be a powerful indication for traders looking for confirmation of their market analysis.
FAQ
What is the difference between EMA and SMA?
The key difference lies in their calculation method and responsiveness to price changes. EMA gives more weight to recent prices, making it more suitable for short-term traders, whereas SMA provides equal weight to all prices and is favored by longer-term traders.
Which moving average indicator should I use?
The choice depends on your trading strategy and time horizon. EMA is ideal for short-term traders seeking quick entries and exits, while SMA is better suited for long-term investors focused on overall market trends.
Can I use both EMA and SMA together?
Absolutely! Combining EMA and SMA can provide valuable insights and confirmation signals. For example, the crossover of EMA and SMA lines can indicate potential trend changes, helping traders make more informed decisions.
In conclusion, both EMA and SMA have their advantages and disadvantages. It is important to understand the characteristics of each moving average indicator and align them with your trading strategy and goals. With this knowledge, you can make informed decisions and improve your success as a trader.
Ready to put your knowledge of EMA and SMA to the test in a real-world trading environment? Look no further than Morpher, the groundbreaking trading platform that's changing the game with blockchain technology. With Morpher, you can effortlessly apply your moving average strategies across a diverse range of asset classes, from stocks and cryptocurrencies to forex and even niche markets. Experience the future of trading with zero fees, infinite liquidity, and the flexibility of fractional investing and short selling. Plus, enjoy the added benefits of up to 10x leverage and the security of the Morpher Wallet. Don't miss out on this unique trading experience. Sign Up and Get Your Free Sign Up Bonus today and start trading on a platform that's as advanced as your strategies!

Disclaimer: All investments involve risk, and the past performance of a security, industry, sector, market, financial product, trading strategy, or individual’s trading does not guarantee future results or returns. Investors are fully responsible for any investment decisions they make. Such decisions should be based solely on an evaluation of their financial circumstances, investment objectives, risk tolerance, and liquidity needs. This post does not constitute investment advice.

Painless trading for everyone
Hundreds of markets all in one place - Apple, Bitcoin, Gold, Watches, NFTs, Sneakers and so much more.
Painless trading for everyone
Hundreds of markets all in one place - Apple, Bitcoin, Gold, Watches, NFTs, Sneakers and so much more.